Fig. 1
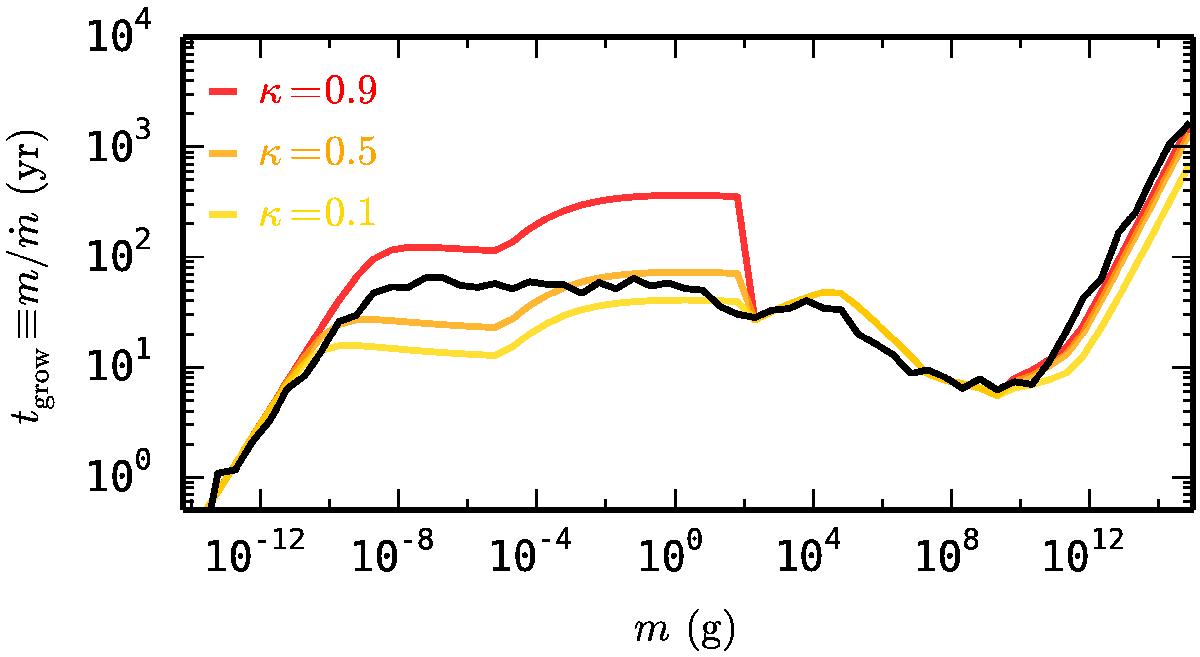
Growth timescales of highly porous aggregates in an MMSN-like disk at 5 AU with a turbulence of α = 10-3. The solid black line is obtained with Monte Carlo models that take into account the full particle size and porosity distributions (Krijt et al. 2015) and the colored lines show Eq. (11) for three different values of κ (see text).
Current usage metrics show cumulative count of Article Views (full-text article views including HTML views, PDF and ePub downloads, according to the available data) and Abstracts Views on Vision4Press platform.
Data correspond to usage on the plateform after 2015. The current usage metrics is available 48-96 hours after online publication and is updated daily on week days.
Initial download of the metrics may take a while.