Fig. A.1
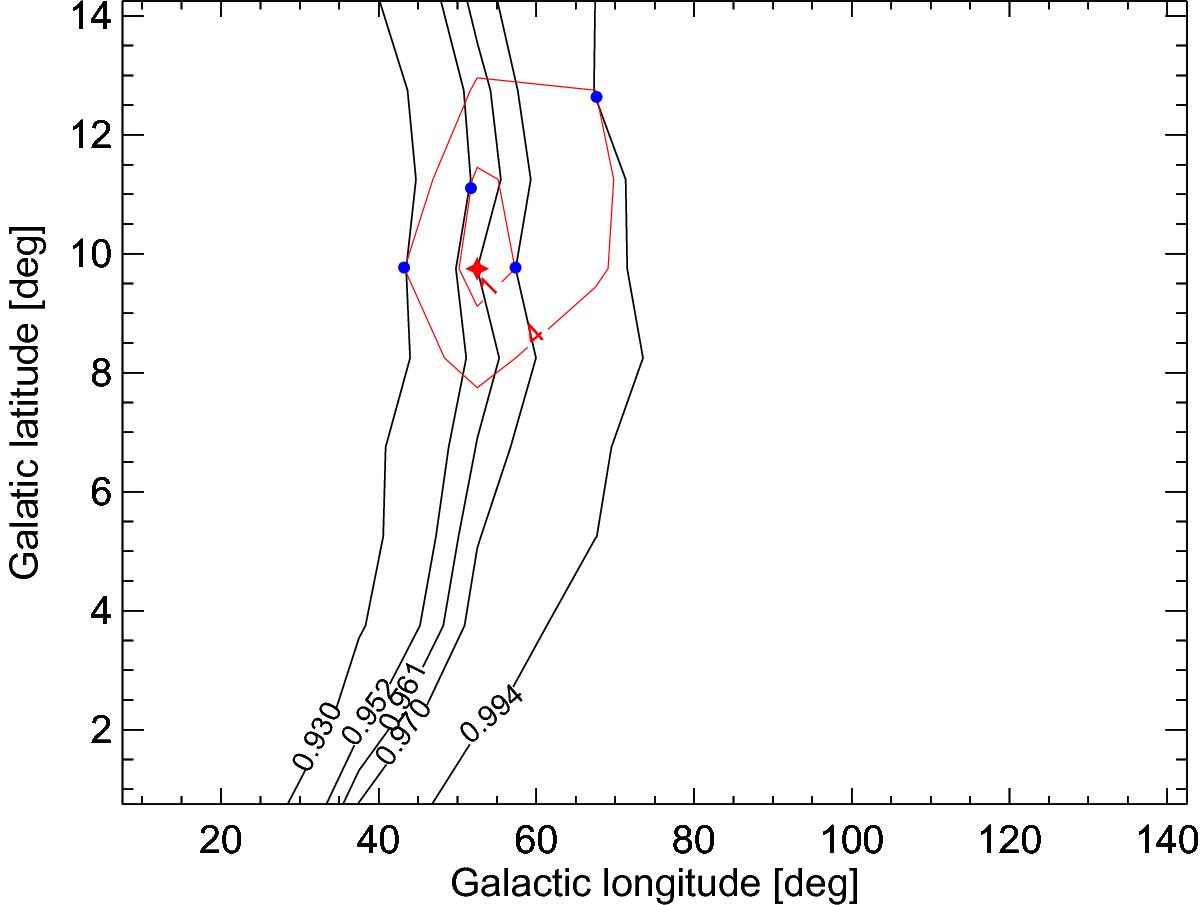
511 keV line flux in the bulge, dependent on the disk size (analogous to Fig. 6). Shown are the lines of equal flux touching the (2Δlog (L) = 1)-, and (2Δlog (L) = 4)-contours, respectively, marked by the blue dots. These tangents correspond to the 1 and 2σ uncertainties of the line flux in the bulge with respect to the disk size (longitude and latitude extent). The star symbol is marking the point with the largest likelihood at 0.961 × 10⁻³ ph cm-2 s-1. The resulting 1 and 2σ-uncertainties are (0.961 ± 0.009) × 10-3 ph cm-2 s-1, and ![]() , respectively.
, respectively.
Current usage metrics show cumulative count of Article Views (full-text article views including HTML views, PDF and ePub downloads, according to the available data) and Abstracts Views on Vision4Press platform.
Data correspond to usage on the plateform after 2015. The current usage metrics is available 48-96 hours after online publication and is updated daily on week days.
Initial download of the metrics may take a while.