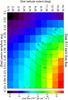
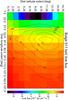
Fig. 6

Dependence of the 511 keV line intensity in the disk (top) and the bulge (bottom) as a function of the choice of the disk extent (1σ Gaussian width value). Line intensities are shown as shading, see scale on right-hand axis. Overlaid are the uncertainty contours for the disk size, as derived from the maximum likelihood fits in the grid-scan. See Appendix A.3 for more details and other parameter impacts.
Current usage metrics show cumulative count of Article Views (full-text article views including HTML views, PDF and ePub downloads, according to the available data) and Abstracts Views on Vision4Press platform.
Data correspond to usage on the plateform after 2015. The current usage metrics is available 48-96 hours after online publication and is updated daily on week days.
Initial download of the metrics may take a while.