Fig. 2
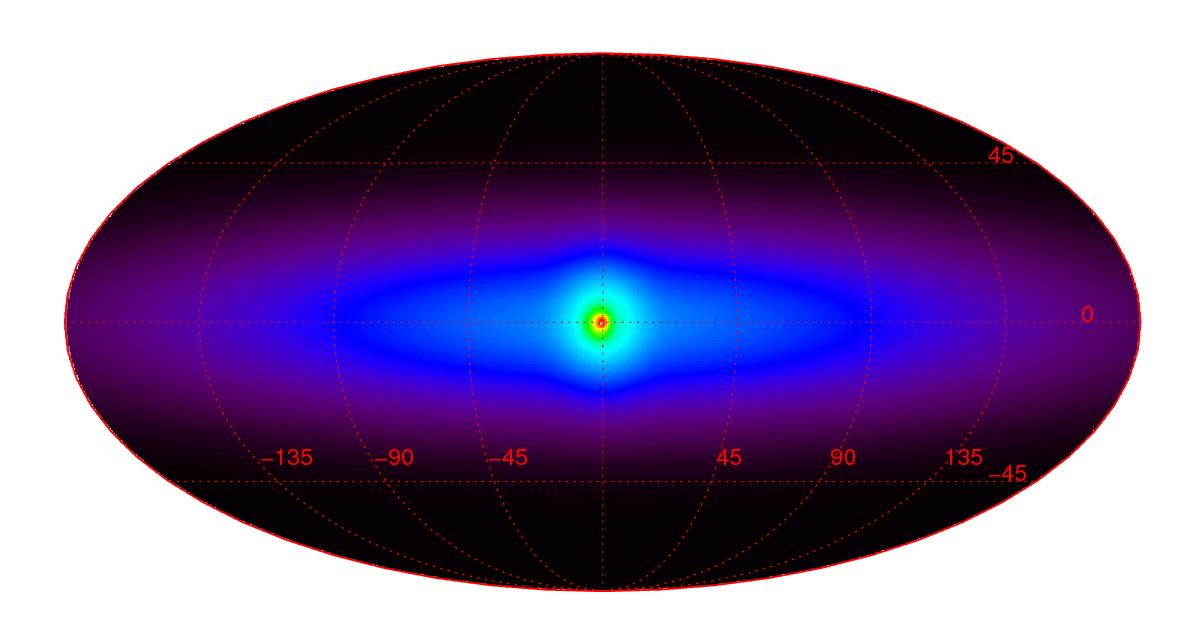
Image showing the model components as assessed in the sky model fit study. The components are related to the ones from Skinner et al. (2014), see Table 2 for details. The weighted sum of fluxes for each celestial component in the 80 bins in the analysed energy band from 490 to 530 keV is shown. Two additional point sources to improve the fit, the Crab and Cyg X-1, are not shown. The image has been scaled by taking the cube root to emphasise the low surface-brightness and extent of the disk.
Current usage metrics show cumulative count of Article Views (full-text article views including HTML views, PDF and ePub downloads, according to the available data) and Abstracts Views on Vision4Press platform.
Data correspond to usage on the plateform after 2015. The current usage metrics is available 48-96 hours after online publication and is updated daily on week days.
Initial download of the metrics may take a while.