Fig. 7
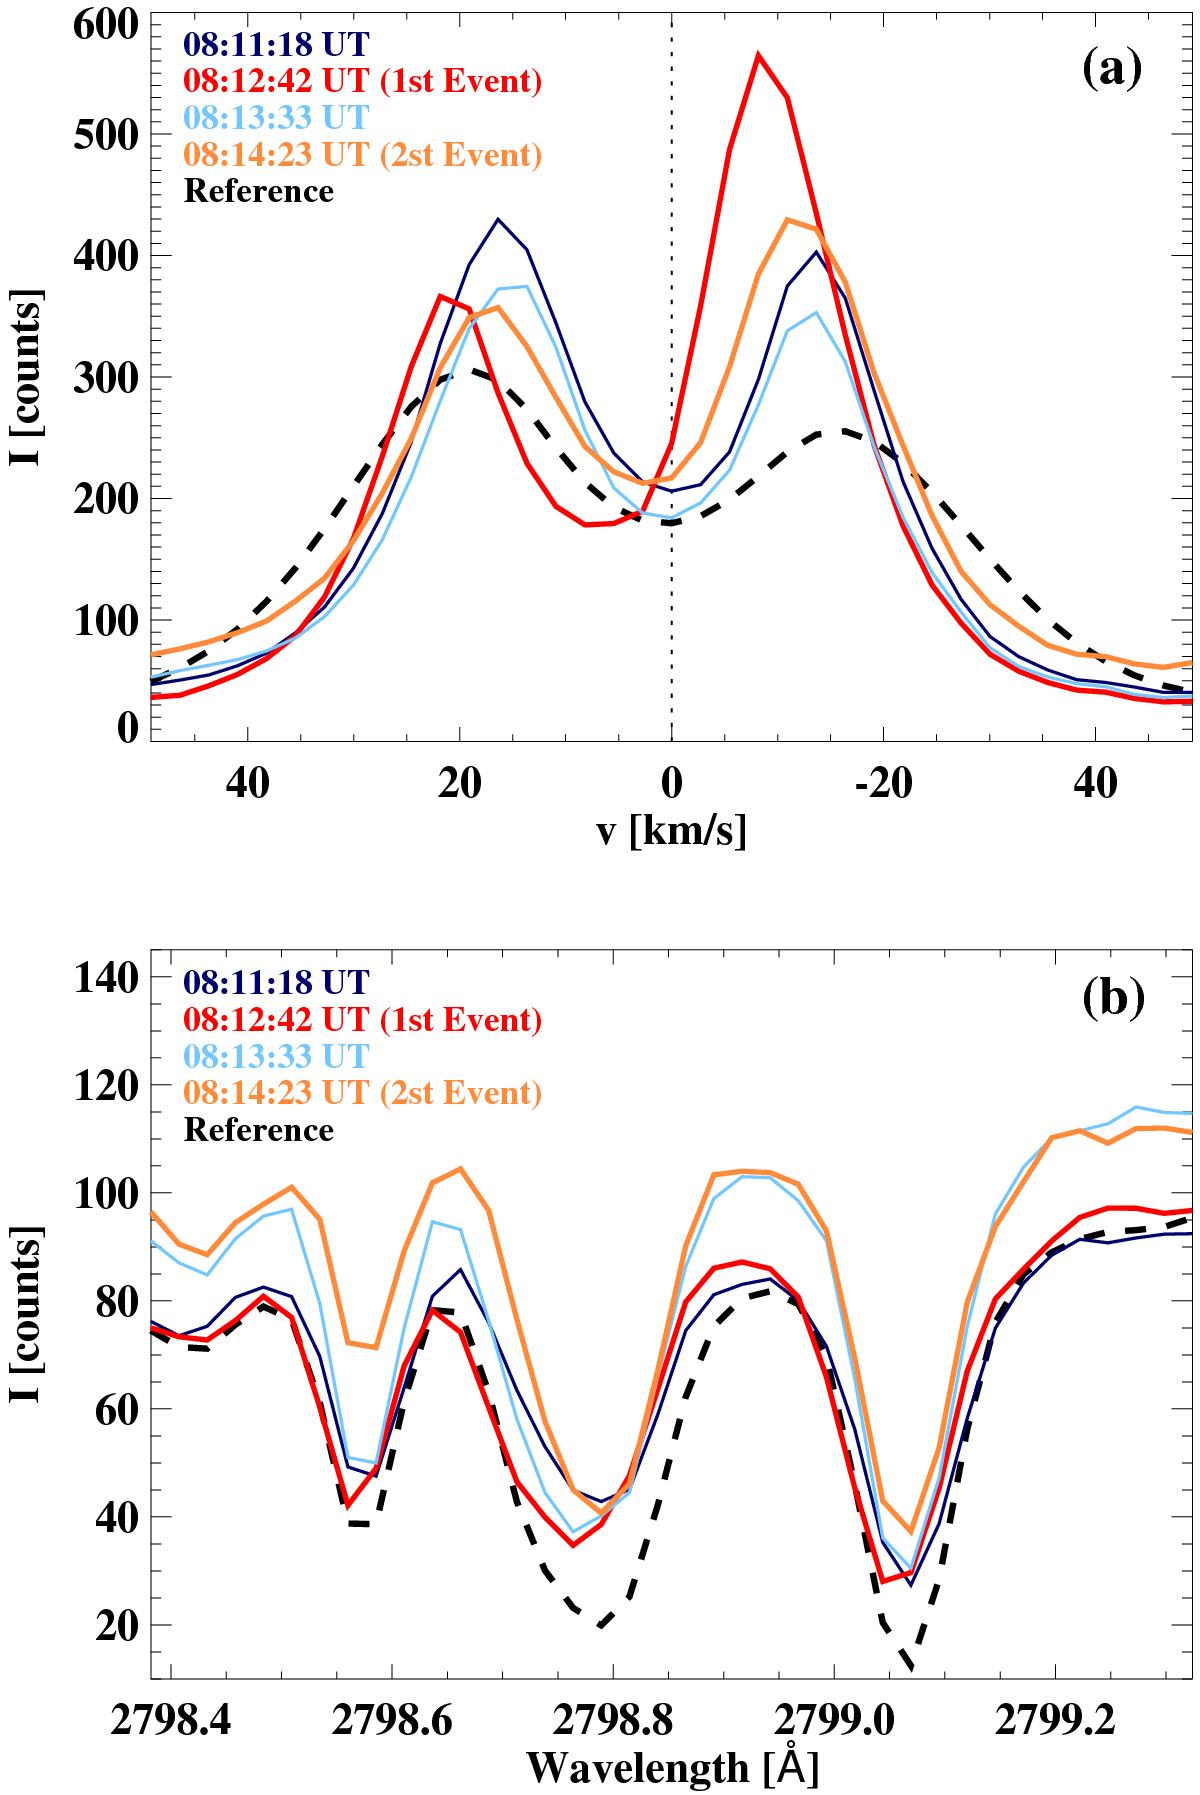
Mean line profiles of a) Mg II k 2796 Å and b) subordinate Mg II 2798.8 Å lines in a subregion of the ROI, indicated with the strip in Fig. 6, at some specific times including the observations of the vortex edges by the IRIS slit (i.e., 08:12:42 UT and 08:14:23 UT for the first and second upflow event, respectively). The mean line profile (black dashed line) in the full FOV of the IRIS spectrograph excluding the vortex region is also shown at each panel as a reference.
Current usage metrics show cumulative count of Article Views (full-text article views including HTML views, PDF and ePub downloads, according to the available data) and Abstracts Views on Vision4Press platform.
Data correspond to usage on the plateform after 2015. The current usage metrics is available 48-96 hours after online publication and is updated daily on week days.
Initial download of the metrics may take a while.