Fig. 6
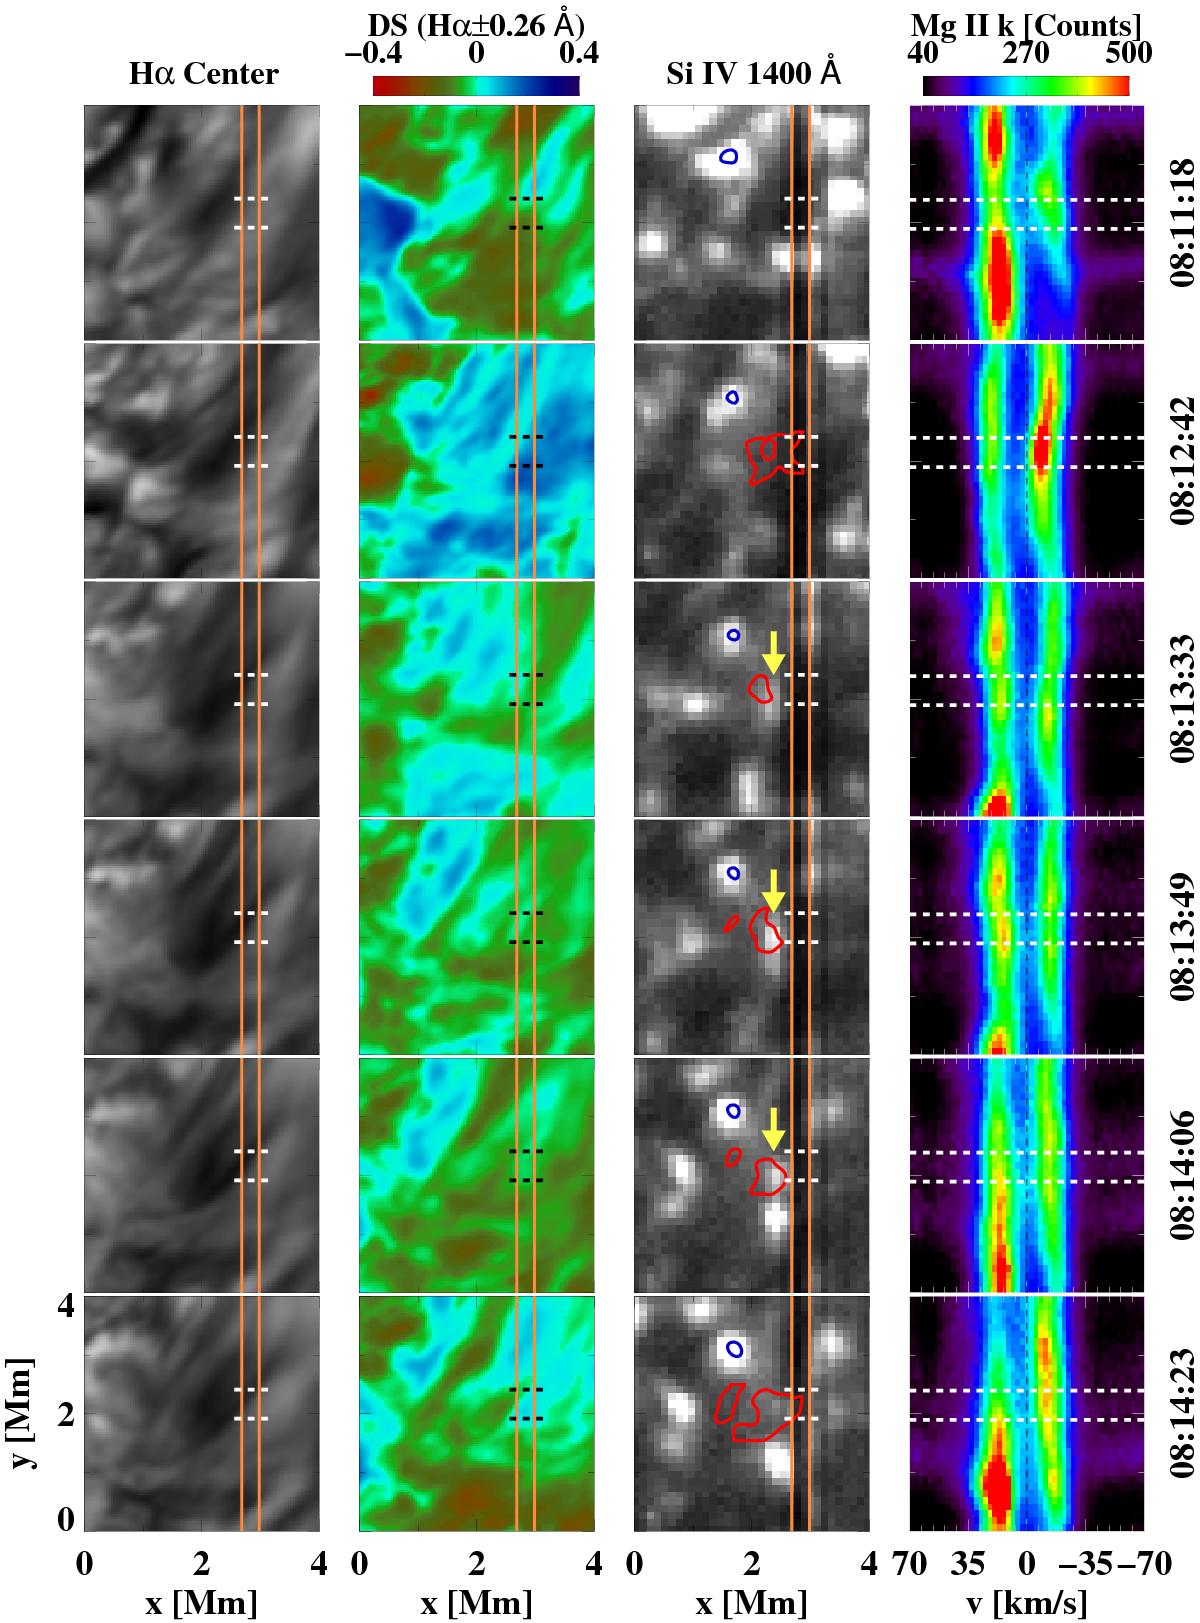
Simultaneous Hα and UV observations of the vortex region. The Hα line center images (Col. 1), DS maps at Hα ± 0.26 Å (Col. 2), IRIS Si IV 1400 Å SJIs (Col. 3) of the ROI, as well as the respective IRIS Mg II k 2796 Å spectra (Col. 4), are shown at certain times before and during the two upflow events. The red and blue contours on the SJIs represent the two spiral arms of the vortex and their neighboring bright point seen in the Hα −0.77 Å images, respectively. The IRIS slit is indicated with two vertical lines in each panel in Cols. 1–3. A subregion on the slit is shown with a dashed strip in each panel, which is used for determining the mean line profiles of Mg II k 2796 Å and subordinate Mg II 2798.8 Å lines in Fig. 7. A positive (negative) Doppler velocity corresponds to an upflow (downflow).
Current usage metrics show cumulative count of Article Views (full-text article views including HTML views, PDF and ePub downloads, according to the available data) and Abstracts Views on Vision4Press platform.
Data correspond to usage on the plateform after 2015. The current usage metrics is available 48-96 hours after online publication and is updated daily on week days.
Initial download of the metrics may take a while.