Fig. 4
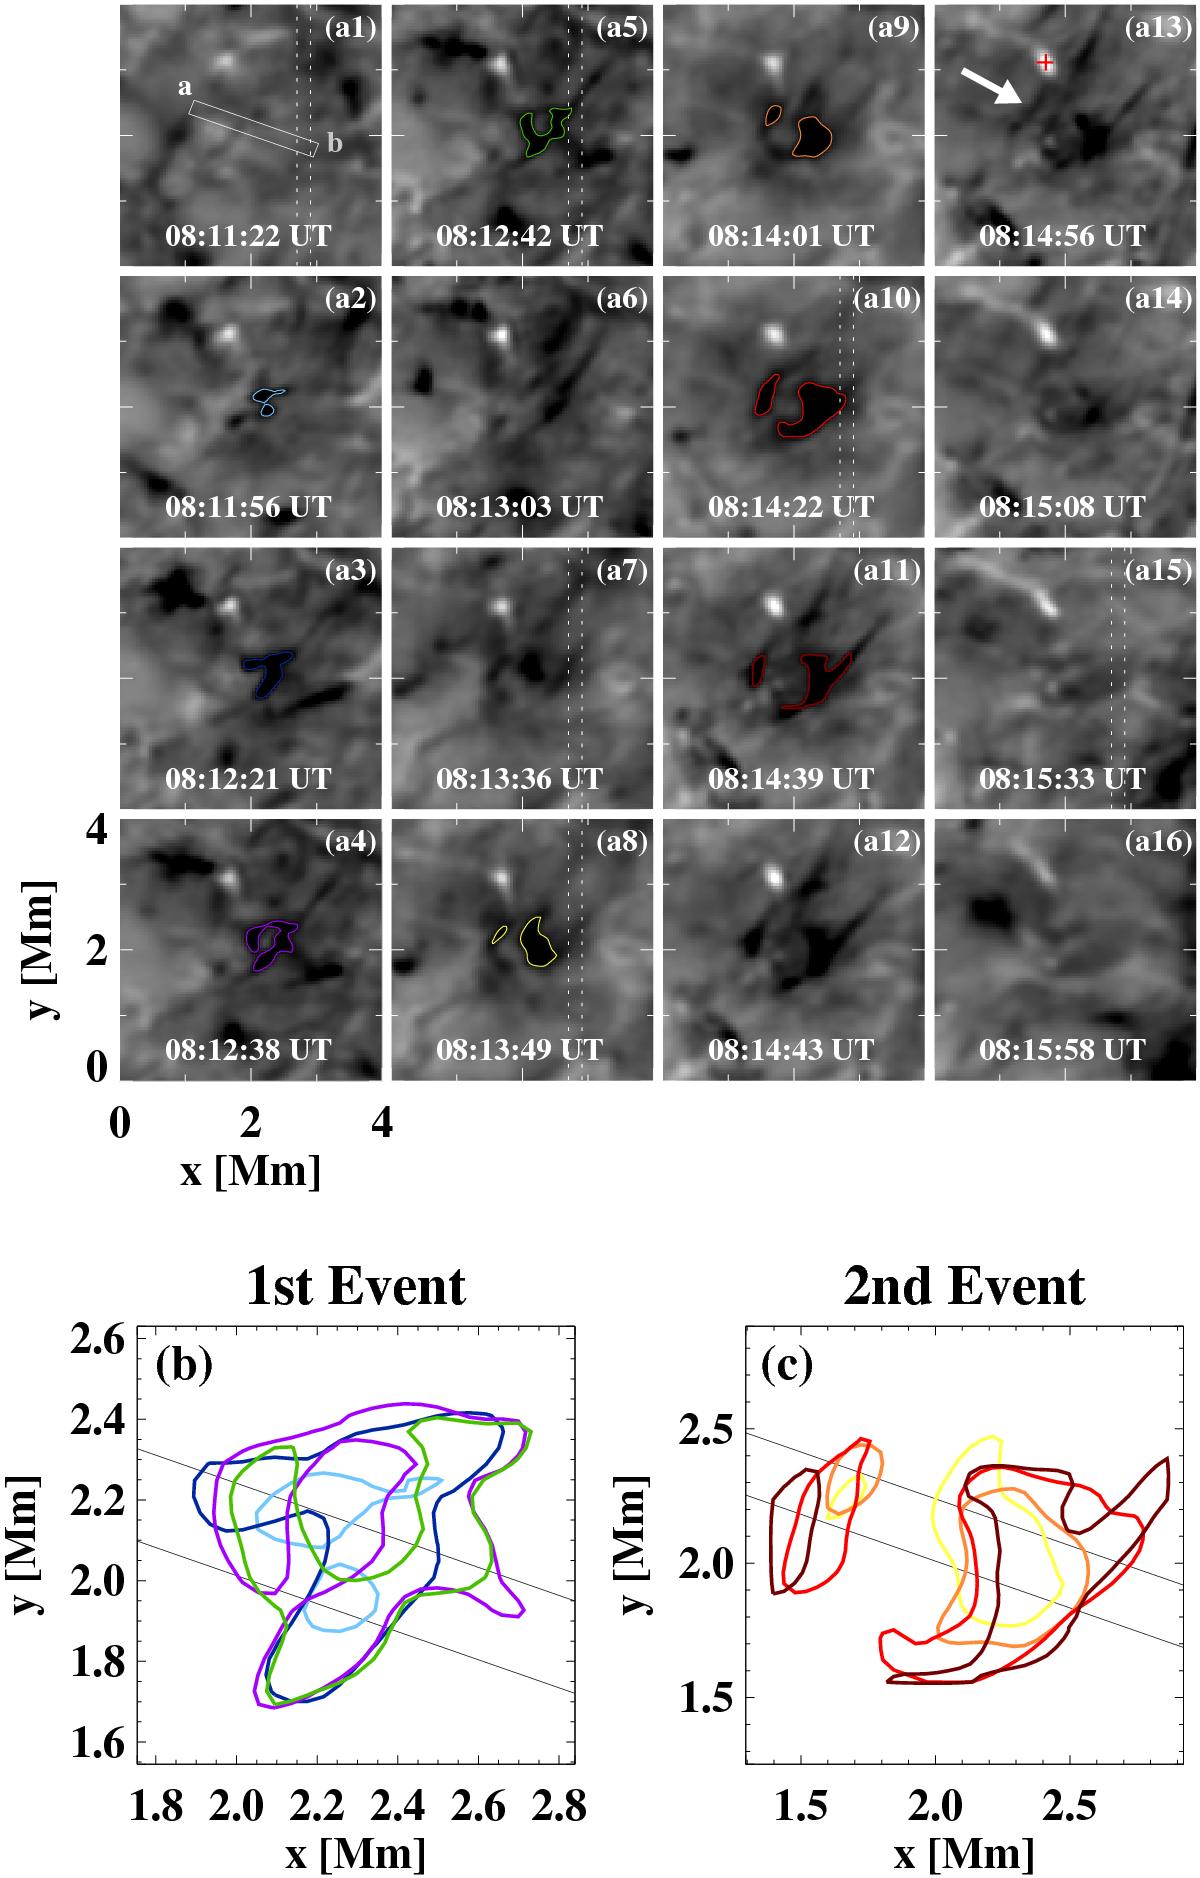
Temporal evolution of the two consecutive upflow events. The sequence of the Hα −0.77 Å images of the ROI during the two upflow events is shown in panels a1–16. The 2 Mm slit (a)–b) in panel a1 indicates the cut location used for the space-time slice image shown in Fig. 5. The arrow in panel a13 denotes a top left spiral arm, which encounters a neighboring bright point indicated with a red cross in the same panel. The locations of the cotemporal IRIS slit are indicated with two vertical dotted lines on several panels, which are used for the investigation of the IRIS Mg II k spectrum in Figs. 6 and 7. The outlines of the vortical structures in some of panels a1–a16 during the first and second events are overplotted with different colored contours in panels b) and c), respectively.
Current usage metrics show cumulative count of Article Views (full-text article views including HTML views, PDF and ePub downloads, according to the available data) and Abstracts Views on Vision4Press platform.
Data correspond to usage on the plateform after 2015. The current usage metrics is available 48-96 hours after online publication and is updated daily on week days.
Initial download of the metrics may take a while.