Fig. 3
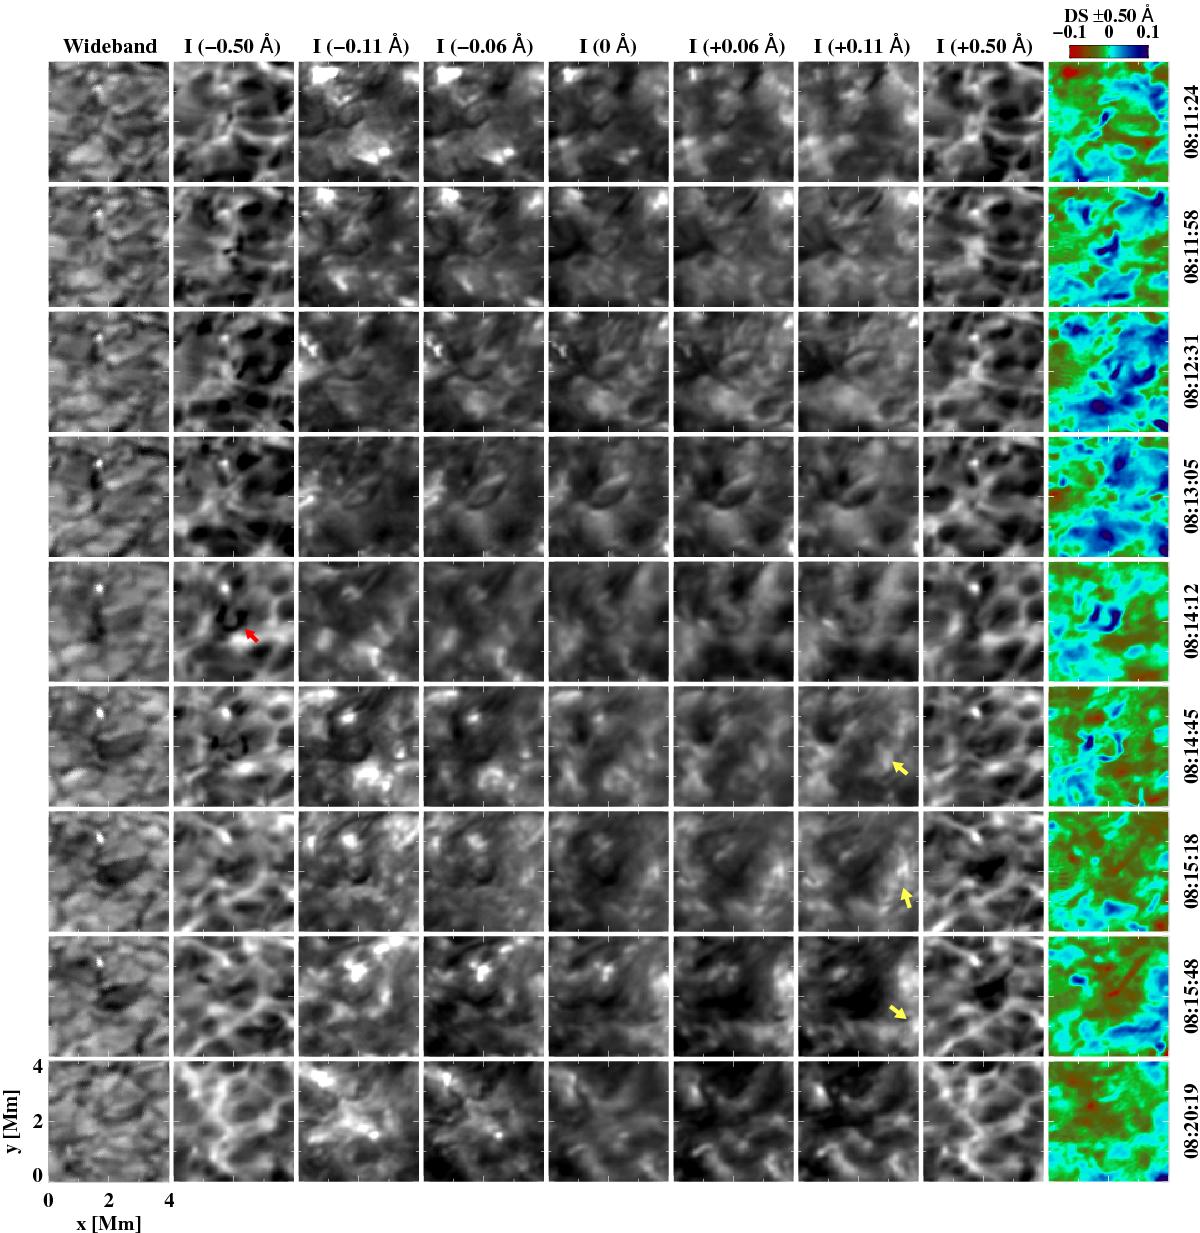
Sequence of the Ca II 8542 Å wideband (Col. 1) and narrowband (Cols. 2–8: −0.5 Å, −0.11 Å, −0.06 Å, the Ca II 8542 Å line center, +0.06 Å, +0.11 Å and +0.5 Å) images of the ROI, including DS maps at Ca II±0.5 Å (Col. 9). Respective times of observation are shown along the right ordinate. Some arc-shaped propagating bright features are indicated with arrows in Col. 7. This figure is accompanied by a movie.
Current usage metrics show cumulative count of Article Views (full-text article views including HTML views, PDF and ePub downloads, according to the available data) and Abstracts Views on Vision4Press platform.
Data correspond to usage on the plateform after 2015. The current usage metrics is available 48-96 hours after online publication and is updated daily on week days.
Initial download of the metrics may take a while.