Fig. 2
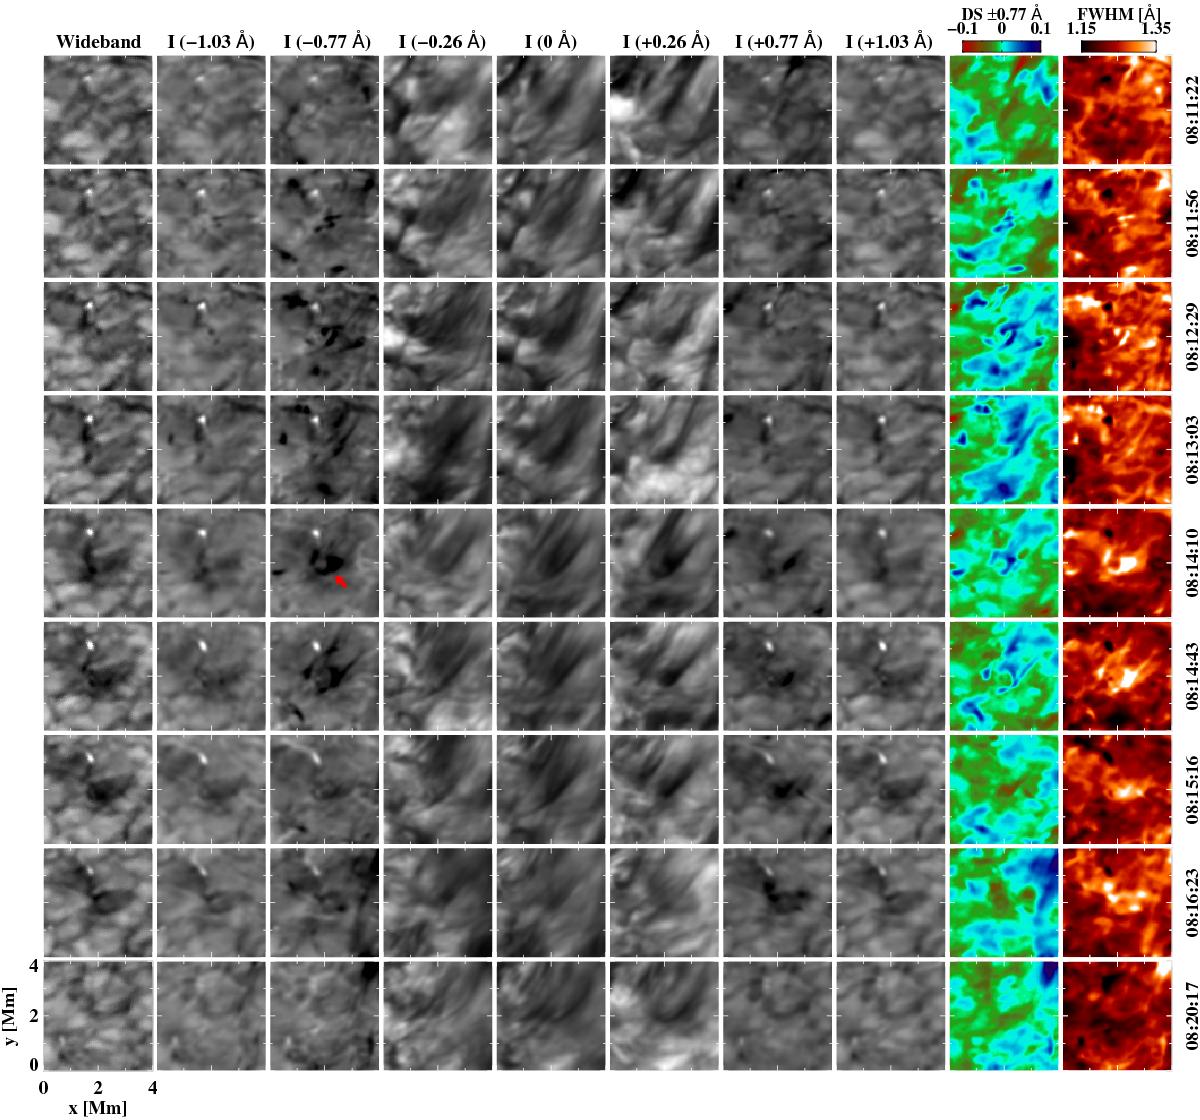
Sequence of the Hα wideband (Col. 1) and narrowband (Cols. 2–8: −1.03 Å, −0.77 Å, −0.26 Å, the Hα line center, +0.26 Å, +0.77 Å and +1.03 Å) images of the ROI, which is indicated with a solid box in Fig. 1b, including the respective maps of DS at ±0.77 Å (Col. 9) and FWHM (Col. 10). Respective times of observation are shown along the right ordinate. This figure is accompanied by a movie. The rightmost column for the FWHM, which is present in Fig. 2, is not included in the movie.
Current usage metrics show cumulative count of Article Views (full-text article views including HTML views, PDF and ePub downloads, according to the available data) and Abstracts Views on Vision4Press platform.
Data correspond to usage on the plateform after 2015. The current usage metrics is available 48-96 hours after online publication and is updated daily on week days.
Initial download of the metrics may take a while.