Fig. 1
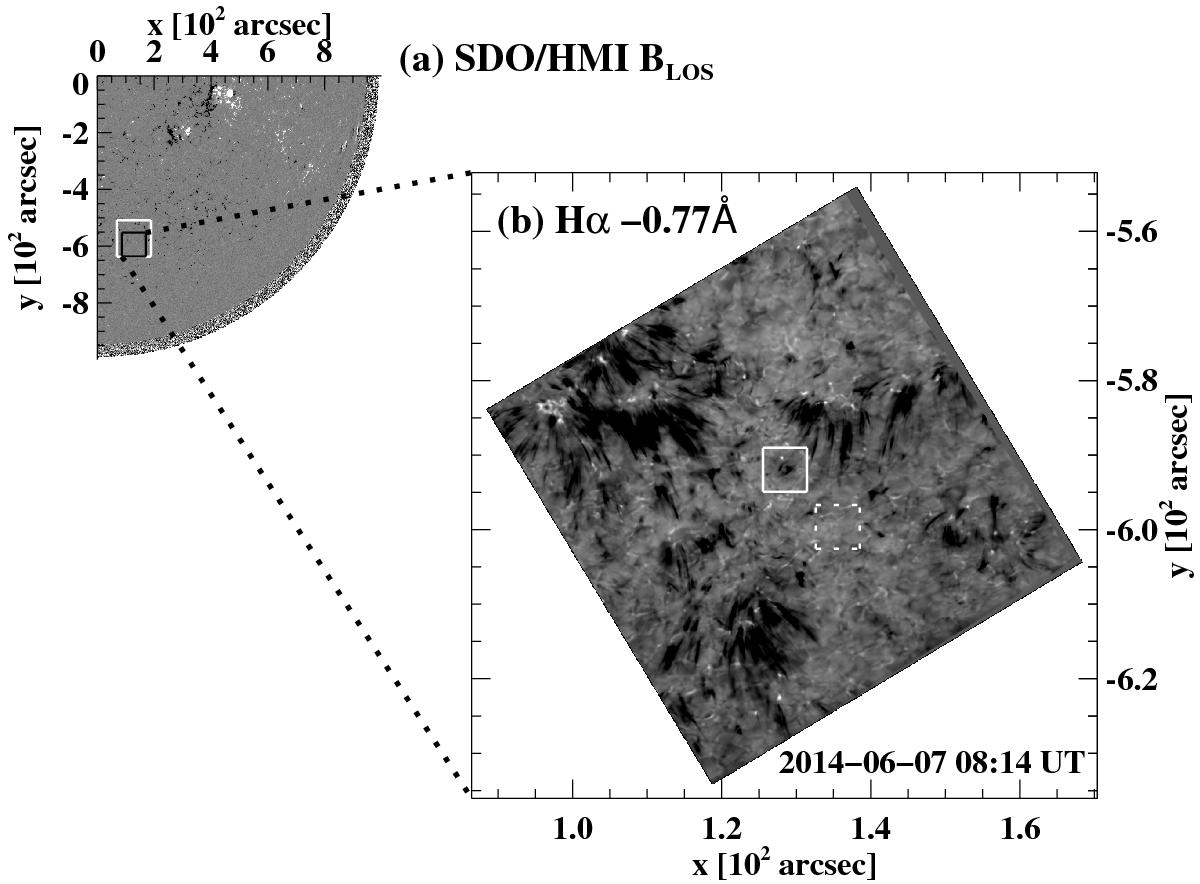
a) HMI line-of-sight magnetogram with the FOVs of the CRISP and IRIS observations overplotted in black and white rectangles, respectively. b) A sample of the cotemporal CRISP FOV Hα −0.77 Å image. The overplotted white solid and dashed rectangles in panel b indicate the ROI (i.e., the FOV of Figs. 2–4a and Cols. 1–3 of Fig. 6) and a neighboring typical quiet Sun region considered in determining the average Hα line reference profile, respectively.
Current usage metrics show cumulative count of Article Views (full-text article views including HTML views, PDF and ePub downloads, according to the available data) and Abstracts Views on Vision4Press platform.
Data correspond to usage on the plateform after 2015. The current usage metrics is available 48-96 hours after online publication and is updated daily on week days.
Initial download of the metrics may take a while.