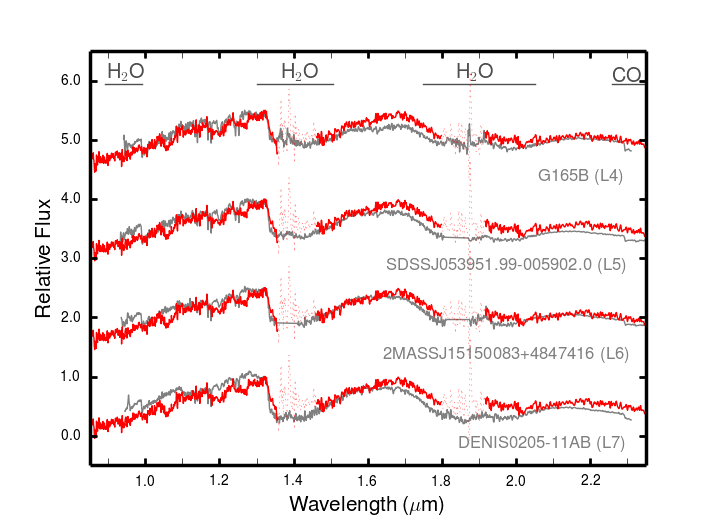
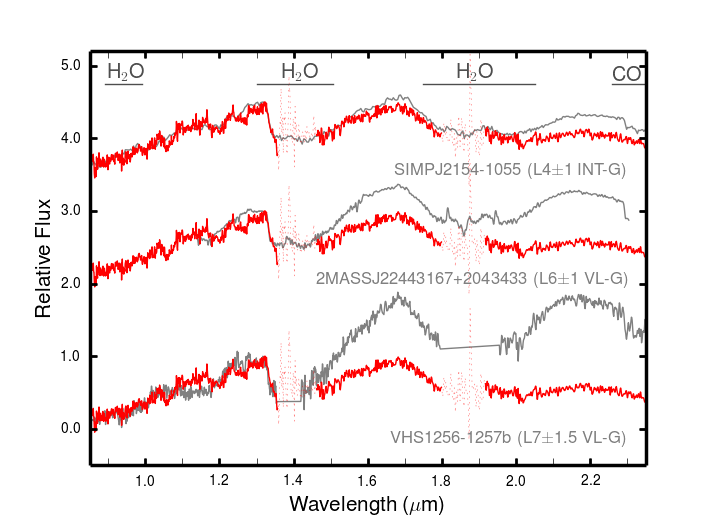
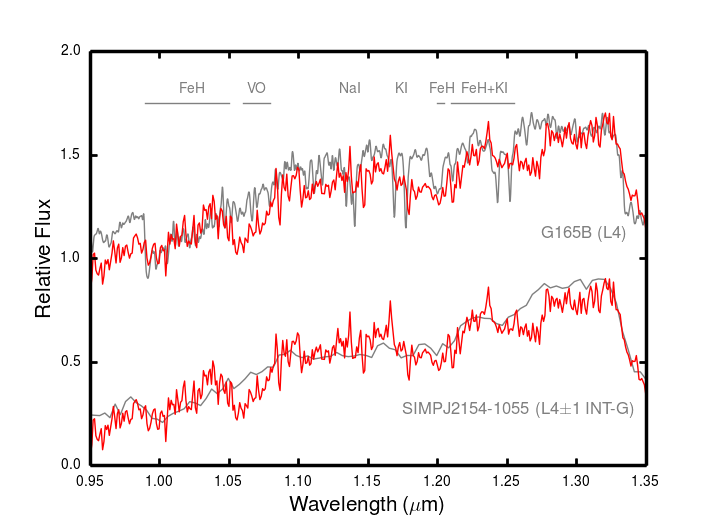
Fig. 8
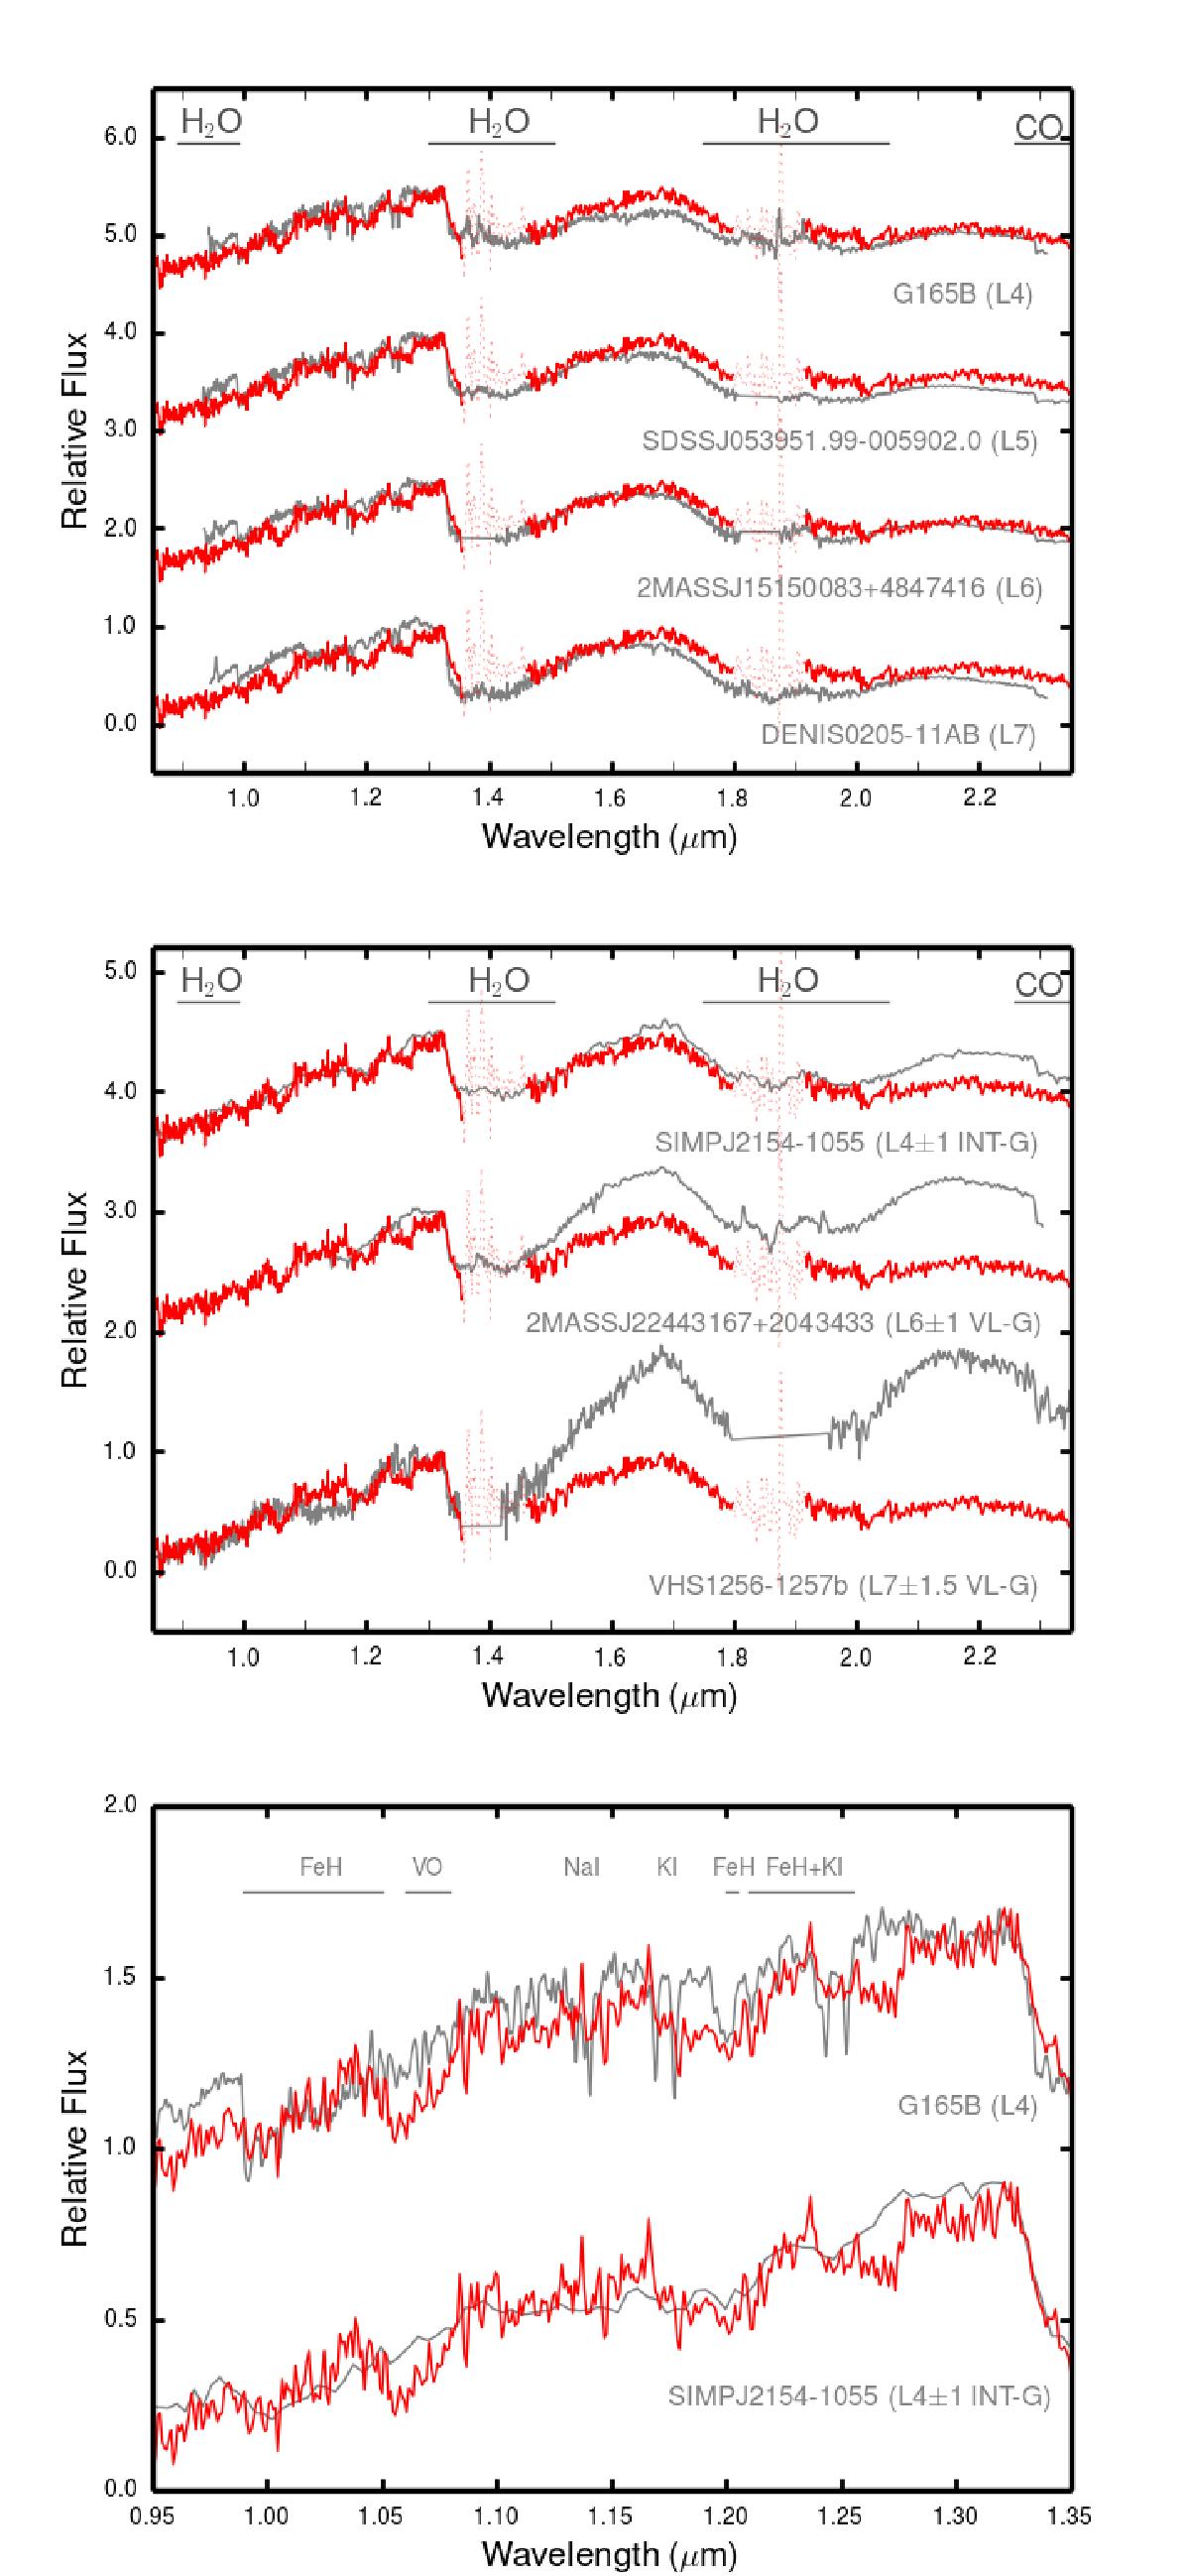
FIRE low-resolution near-infrared spectrum of J1551−2134 (solid red line) compared with field high-gravity dwarf templates (top panel) and with young low- (VL–G) and intermediate-gravity (INT-G) L dwarfs (middle panel). The comparison spectra are labelled and plotted with solid gray lines (see text for proper references to the data). Red dotted lines depict the wavelength regions strongly affected by telluric absorption. The bottom panel illustrates the enlargement of J1551−2134’s FIRE spectrum at around the K i lines (J-band). All spectra are normalized to unity at 1.32 μm and are shifted by a constant in the vertical direction. Some molecular and atomic features are identified.
Current usage metrics show cumulative count of Article Views (full-text article views including HTML views, PDF and ePub downloads, according to the available data) and Abstracts Views on Vision4Press platform.
Data correspond to usage on the plateform after 2015. The current usage metrics is available 48-96 hours after online publication and is updated daily on week days.
Initial download of the metrics may take a while.