Fig. 1
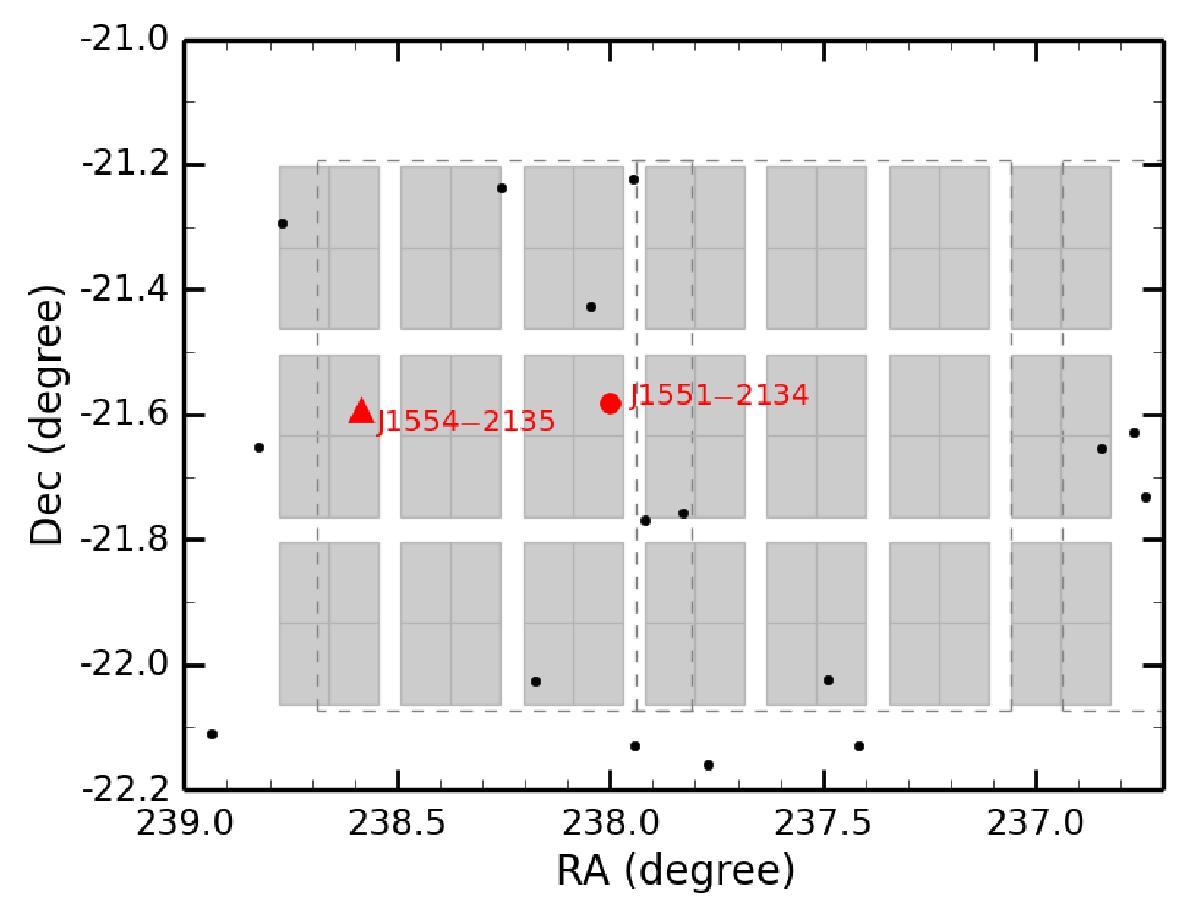
Distribution of the 21 VIMOS pointings (gray squares) in the right ascension-declination diagram. The UKIDSS coverage overlapping with the VIMOS survey is indicated by the dashed gray lines (Lodieu et al. 2006, 2011). The red symbols represent the two final USco member candidates – labelled with their abridged names – selected from our combined photometric and astrometric study. Black dots represent the known USco member candidates and confirmed members (Lodieu et al. 2006, 2011; Béjar et al. 2009; Dawson et al. 2014) that fall within the VIMOS region and its surroundings.
Current usage metrics show cumulative count of Article Views (full-text article views including HTML views, PDF and ePub downloads, according to the available data) and Abstracts Views on Vision4Press platform.
Data correspond to usage on the plateform after 2015. The current usage metrics is available 48-96 hours after online publication and is updated daily on week days.
Initial download of the metrics may take a while.