Fig. 4
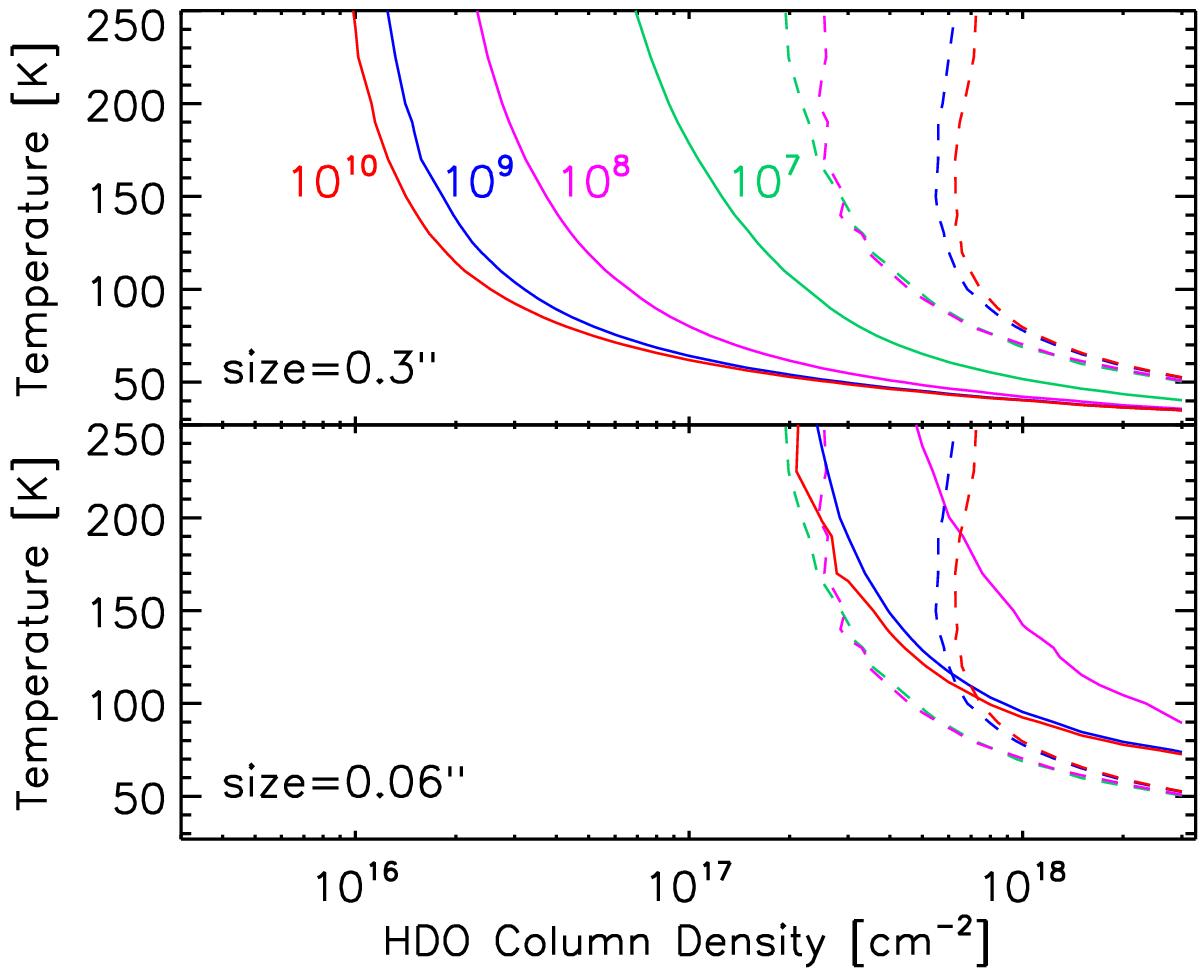
LVG predictions of the temperature versus HDO column density required to reproduce the observed velocity-integrated emission (solid curves) and to have unit line opacity (dashed curves) for densities of: 107 cm-3 (green), 108 cm-3 (magenta), 109 cm-3 (blue), and 1010 cm-3 (red). Optical depth increases with column density. The upper panel refers to a source size of 0![]() 3 and the lower panel to 0
3 and the lower panel to 0![]() 06.
06.
Current usage metrics show cumulative count of Article Views (full-text article views including HTML views, PDF and ePub downloads, according to the available data) and Abstracts Views on Vision4Press platform.
Data correspond to usage on the plateform after 2015. The current usage metrics is available 48-96 hours after online publication and is updated daily on week days.
Initial download of the metrics may take a while.