Fig. 2
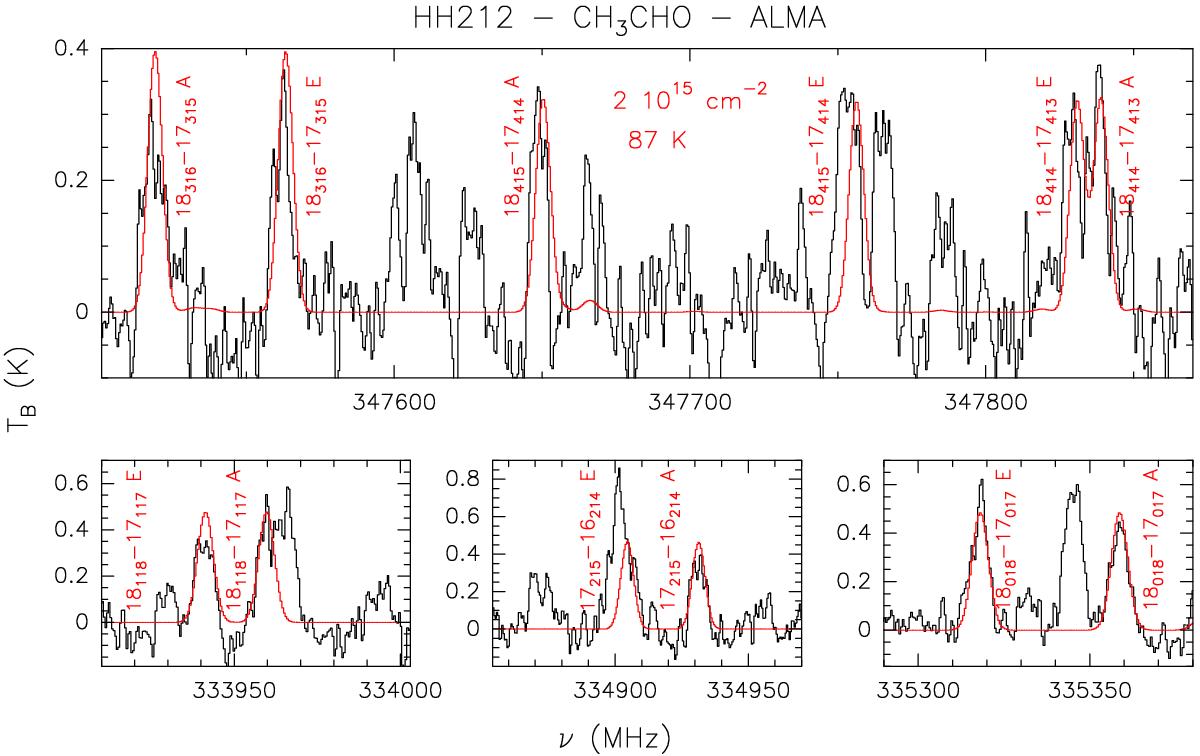
CH3CHO emission (in TB scale) extracted at the MM1 position. The four panels show the frequency intervals where the CH3CHO lines are located (see Table 1 for those unblended with other lines). The red line shows the synthetic spectrum which best reproduces the observations assuming LTE and optically thin emission obtained with the GILDAS−Weeds package (Maret et al. 2011) with source size = 0![]() 3, Trot = 87 K, NCH3CHO = 2 × 1015 cm-2, FWHM linewidth = 5.0 km s-1, and LSR velocity = +1.7 km s-1 (see footnote 2).
3, Trot = 87 K, NCH3CHO = 2 × 1015 cm-2, FWHM linewidth = 5.0 km s-1, and LSR velocity = +1.7 km s-1 (see footnote 2).
Current usage metrics show cumulative count of Article Views (full-text article views including HTML views, PDF and ePub downloads, according to the available data) and Abstracts Views on Vision4Press platform.
Data correspond to usage on the plateform after 2015. The current usage metrics is available 48-96 hours after online publication and is updated daily on week days.
Initial download of the metrics may take a while.