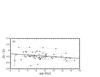
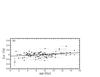
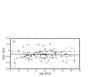
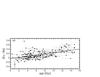
Fig. 8

[Sr/Zr], [La/Ce], [Nd/Sm], and [Eu/Ba] compared to age. Only stars with age uncertainties less than 3 Gyr are plotted. The black line in each plot represents the best fit. The errors on the ages are taken from Bensby et al. (2014). The average error on the abundance ratio is indicated in the lower left part of each plot.
This figure is made of several images, please see below:
Current usage metrics show cumulative count of Article Views (full-text article views including HTML views, PDF and ePub downloads, according to the available data) and Abstracts Views on Vision4Press platform.
Data correspond to usage on the plateform after 2015. The current usage metrics is available 48-96 hours after online publication and is updated daily on week days.
Initial download of the metrics may take a while.