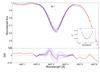
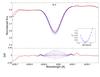
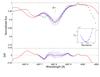
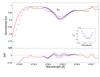
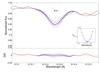
Fig. B.1

Solar spectrum taken using asteroid Vesta during the run at Magellan in January 2006. Spectral lines are listed in order of element and wavelength. Chemical elements with all the hfs lines are indicated inside the lines. The different colored lines represent the different synthetic spectra with different abundances in steps of 0.04 dex, while the dots are the observed spectra. The lower panels show the values of differences between the real and synthetic spectra for the synthetic spectra plotted above. The red lines represent the best fit derived from un-normalized χ2, visible in the small plot as a red dot. Here the fits for the Sr line and the five Zr lines are shown.
Current usage metrics show cumulative count of Article Views (full-text article views including HTML views, PDF and ePub downloads, according to the available data) and Abstracts Views on Vision4Press platform.
Data correspond to usage on the plateform after 2015. The current usage metrics is available 48-96 hours after online publication and is updated daily on week days.
Initial download of the metrics may take a while.