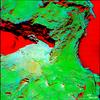
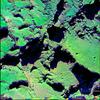
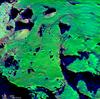
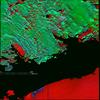
Fig. 12
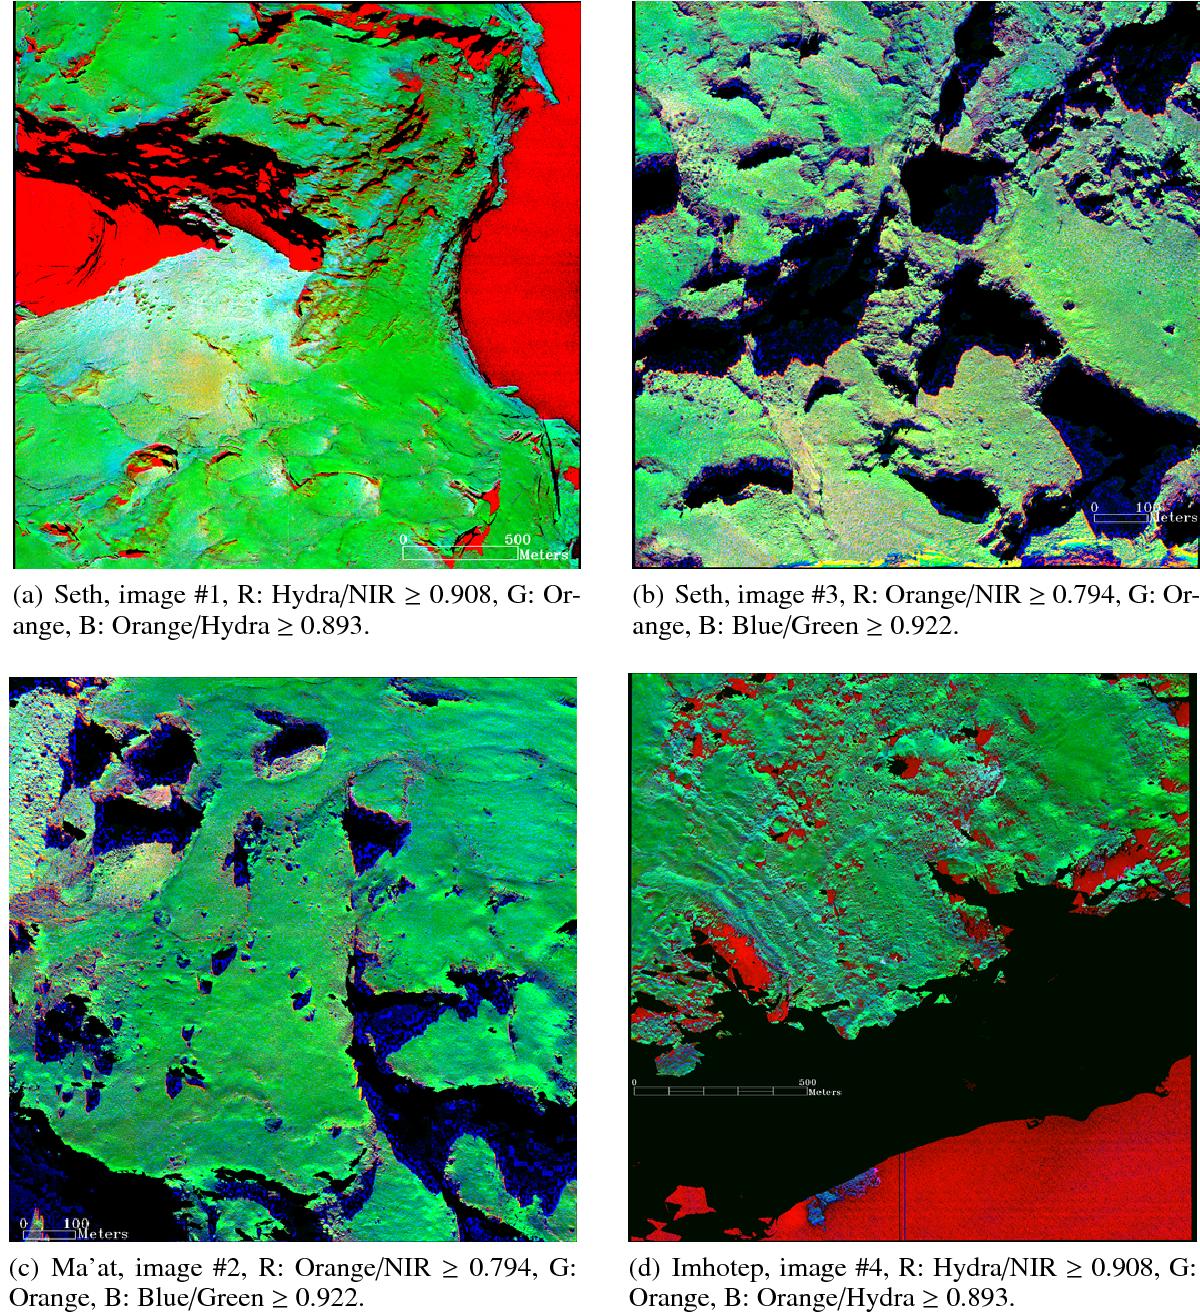
Activity thresholds (Table 3) determined by the spectral ratio plots and assigned to RGB channels. In the images, black indicates the regions excluded because of high geometric angles, while red denotes the low signal regions like shadows and the sky. The shadows, where we still receive decent signals, are shown in shades of blue. Regions where we see activity are in light blue and light pink. Using such images, we can detect the active regions. Image details can be found with corresponding image ID in Table 2.
Current usage metrics show cumulative count of Article Views (full-text article views including HTML views, PDF and ePub downloads, according to the available data) and Abstracts Views on Vision4Press platform.
Data correspond to usage on the plateform after 2015. The current usage metrics is available 48-96 hours after online publication and is updated daily on week days.
Initial download of the metrics may take a while.