Fig. 2
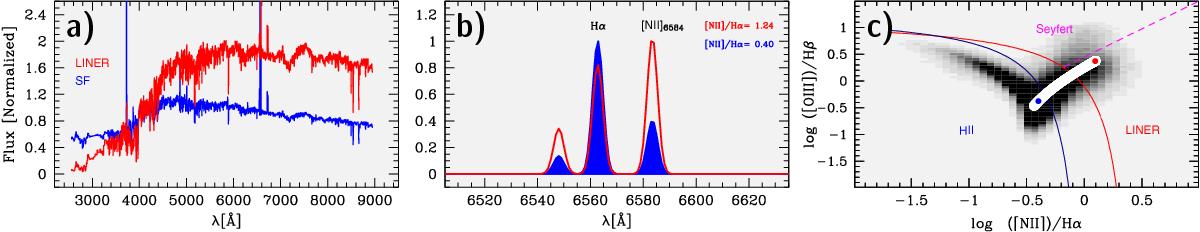
Simulation of spectroscopic aperture bias for an inside-out formed galaxy according to the 1D model described in Sect.3 (see Fig. 3) that is observed with SDSS at a redshift z = 0.1. At this z the SDSS fiber (⌀ = 3′′) covers a projected linear diameter of ~5.5 kpc. a) Comparison between the integrated spectrum of our model galaxy (blue) with that obtained within the SDSS fiber (red). Both spectra are normalized at 4020 Å. b) Zoom-in into the spectral region around the Hα line after removing the underlying stellar continuum. The color coding is the same as in panel a. Note the considerable difference in the [N ii]/Hα emission-line ratio from the integral and simulated SDSS spectrum of the galaxy. From the former, the galaxy would be spectroscopically classifiable as a star-forming galaxy, while the latter would imply a purely retired LINER galaxy. c) Variation of the BPT line ratios as a function of increasing aperture size for the adopted galaxy model (white). The simulated ratios form a continuous sequence along the right wing of the BPT diagram, moving from the LINER toward the Hii zone as the aperture size increases, in close resemblance to the observational trend seen in Fig. 1c. The [N ii]/Hα and [O iii ]/Hβ ratios for the integrated and the simulated SDSS spectrum are shown in blue and red, respectively. The gray shaded background depicts the surface density of galaxies from SDSS, and the overlaid curves are the same as in Fig. 1c.
Current usage metrics show cumulative count of Article Views (full-text article views including HTML views, PDF and ePub downloads, according to the available data) and Abstracts Views on Vision4Press platform.
Data correspond to usage on the plateform after 2015. The current usage metrics is available 48-96 hours after online publication and is updated daily on week days.
Initial download of the metrics may take a while.