Fig. 1
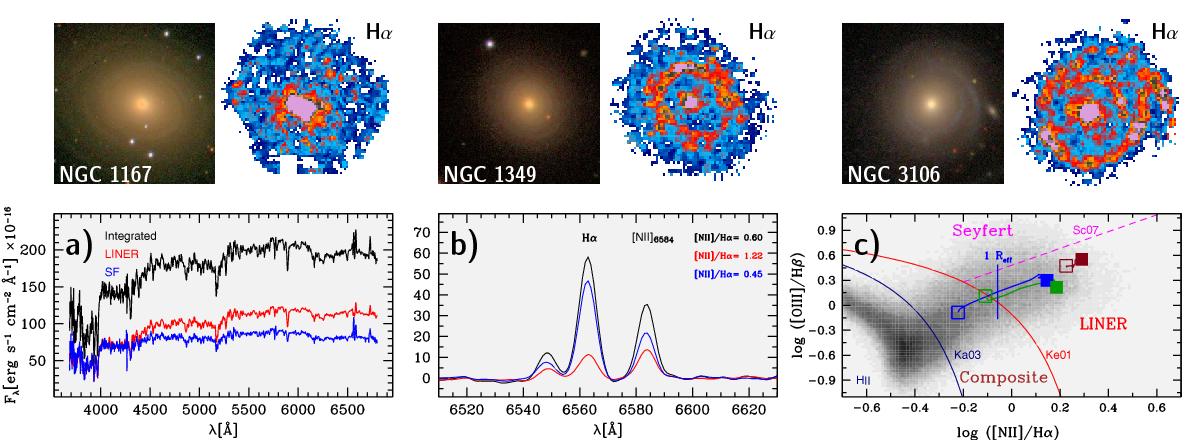
Upper panels: SDSS true-color images and Hα maps (displayed between 0.05 and 1 × 10-16 erg s-1 cm-2) of the three i+ ETGs (NGC 1167, NGC 1349 and NGC 3106; from left to right) studied in Gomes et al. (2015b, 2016). Lower panels: a) comparison of the integrated spectrum of NGC 1349 within its inner (R⋆≤ 8′′) LINER zone (red) with that obtained from its outer (R⋆> 8′′) star-forming zone (blue). The integrated spectrum of the ETG is overlaid in black. b) Zoom-in into the pure nebular spectrum of NGC 1349 around the Hα 6563 Å Balmer line, as obtained after subtracting the best-fitting stellar model from the observed spectrum (see P13 and G15a for details). The color coding is the same as in panel a. Note the change of the [N ii]/Hα emission-line flux ratio from the inner (LINER) to the outer (SF-dominated) zone. c) Variation of the diagnostic BPT ratios for the three i+ ETGs as a function of the aperture considered in their analysis. Brown, blue, and green correspond to NGC 1167, NGC 1349, and NGC 3106, respectively. The nuclear BPT ratios and those determined from the integrated galaxy spectra are shown with filled and open squares, respectively, and the connecting lines mark determinations based on successively larger spectroscopic apertures. The equivalent aperture radius in Reff is indicated for NGC 1349 only for the sake of clarity. Note the shift of NGC 1349 from the LINER into the “composite SF/LINER” regime of the BPT diagram when instead of the inner zone (≲0.7 Reff) the integral spectrum of the ETG is considered. The shaded background depicts the surface density of galaxies from SDSS in the upper right wing of the BPT plane. The overlaid curves show the demarcation between AGN and LINERs (Schawinski et al. 2007, SC07), the locus of Hii regions (Kauffmann et al. 2003, Ka03), and the “maximum SF” boundary (Kewley et al. 2001, Ke01).
Current usage metrics show cumulative count of Article Views (full-text article views including HTML views, PDF and ePub downloads, according to the available data) and Abstracts Views on Vision4Press platform.
Data correspond to usage on the plateform after 2015. The current usage metrics is available 48-96 hours after online publication and is updated daily on week days.
Initial download of the metrics may take a while.