Fig. 5
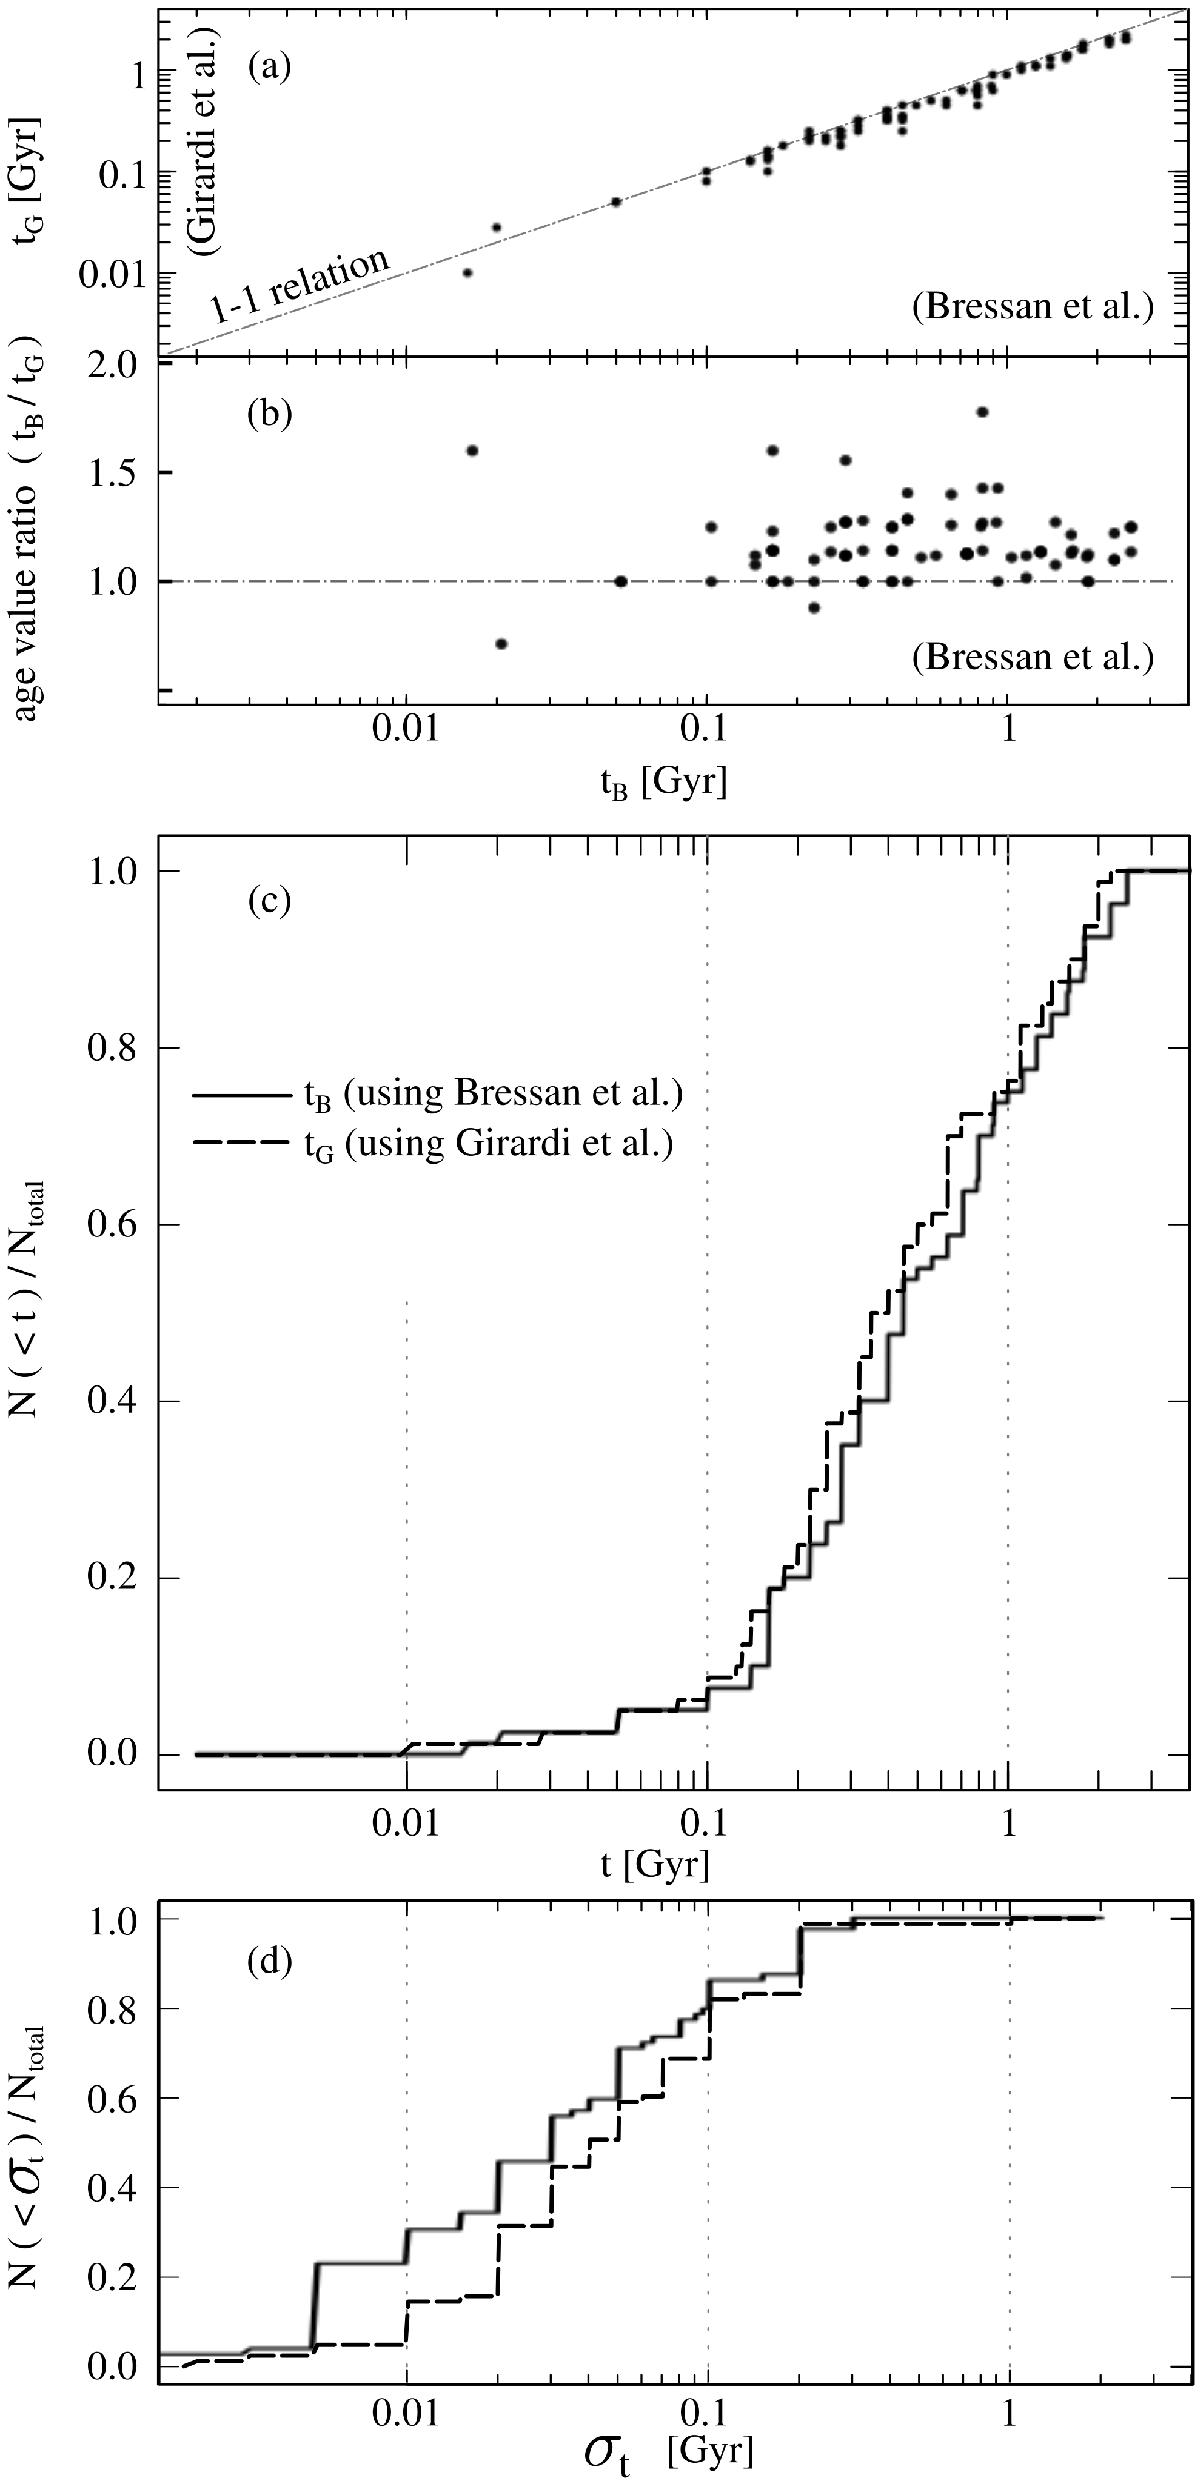
Age determinations using the Girardi et al. (2002) (dashed line) or Bressan et al. (2012) (solid line) set of isochrones. In panel a), the correlation between age estimates determined using both sets of isochrones is shown. A linear fit (not shown in the diagram) yields a slope of 0.98, which implies a slight bias towards greater age estimations when computed with the Bressan et al. models. A one-to-one relation (dot-dashed line) is also shown for the sake of comparison. In panel b), the ratio between ages obtained using Bressan et al. and Girardi et al. models is presented. Values larger than 1 mean that the Bressan et al. age estimates are larger. In panel c), the age ECDFs using the Bressan et al. isochrones (solid line) and the Girardi et al. isochrones (dashed line) are plotted. The uncertainty distributions are represented by the corresponding cumulative distributions in the bottom panel d).
Current usage metrics show cumulative count of Article Views (full-text article views including HTML views, PDF and ePub downloads, according to the available data) and Abstracts Views on Vision4Press platform.
Data correspond to usage on the plateform after 2015. The current usage metrics is available 48-96 hours after online publication and is updated daily on week days.
Initial download of the metrics may take a while.