Fig. 4
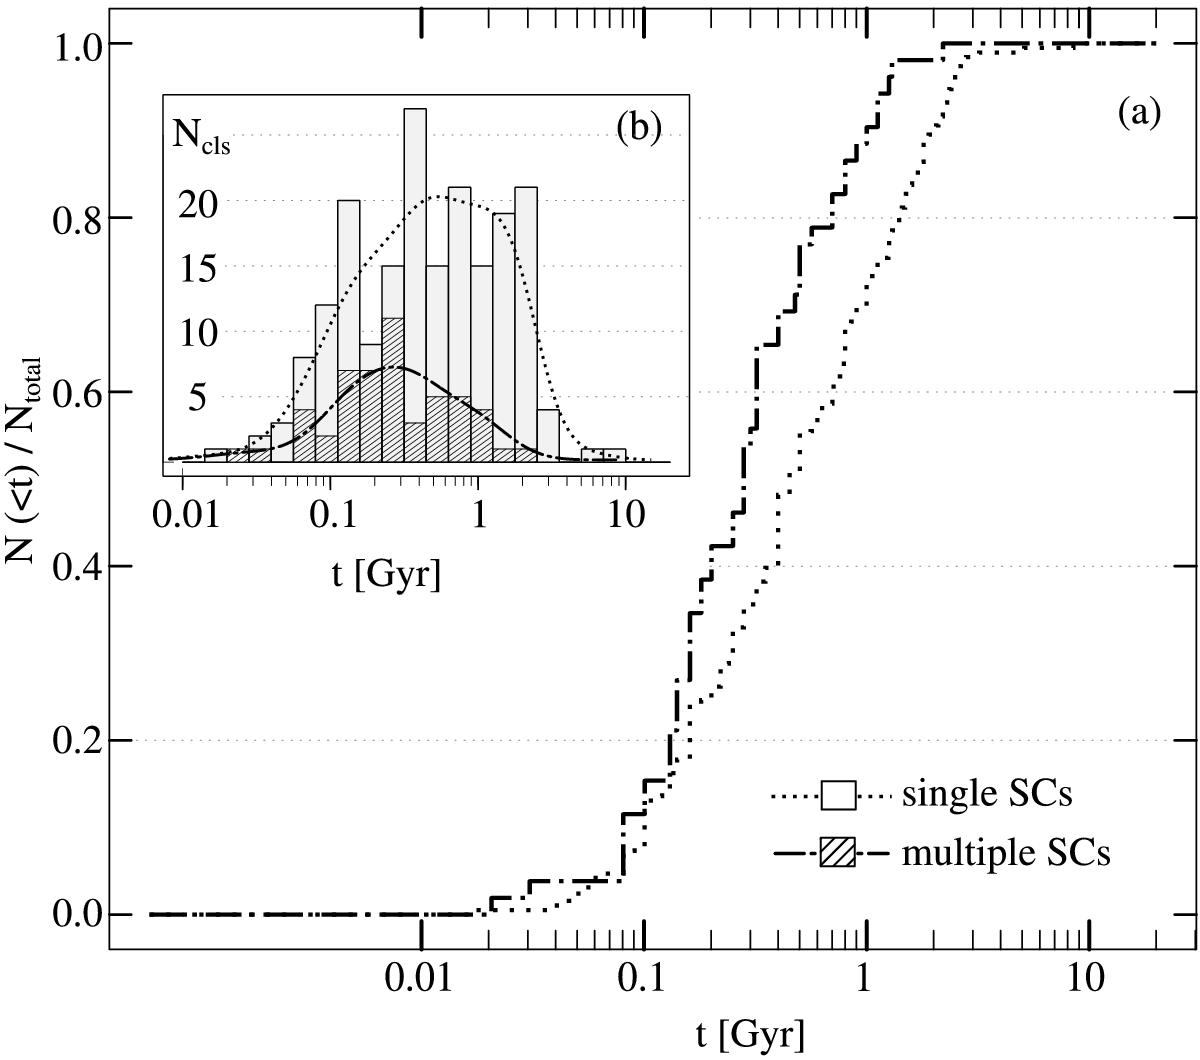
Age distributions for multiple and single LMC clusters. The empirical cumulative distributions for multiple systems (dash-dotted line) and single SCs (dotted line) are shown. In the inset panel (b), the corresponding age histograms are shown (empty and shaded bars for single and multiple SCs, respectively) together with the kernel density estimations of both distributions (solid lines).
Current usage metrics show cumulative count of Article Views (full-text article views including HTML views, PDF and ePub downloads, according to the available data) and Abstracts Views on Vision4Press platform.
Data correspond to usage on the plateform after 2015. The current usage metrics is available 48-96 hours after online publication and is updated daily on week days.
Initial download of the metrics may take a while.