Fig. 3
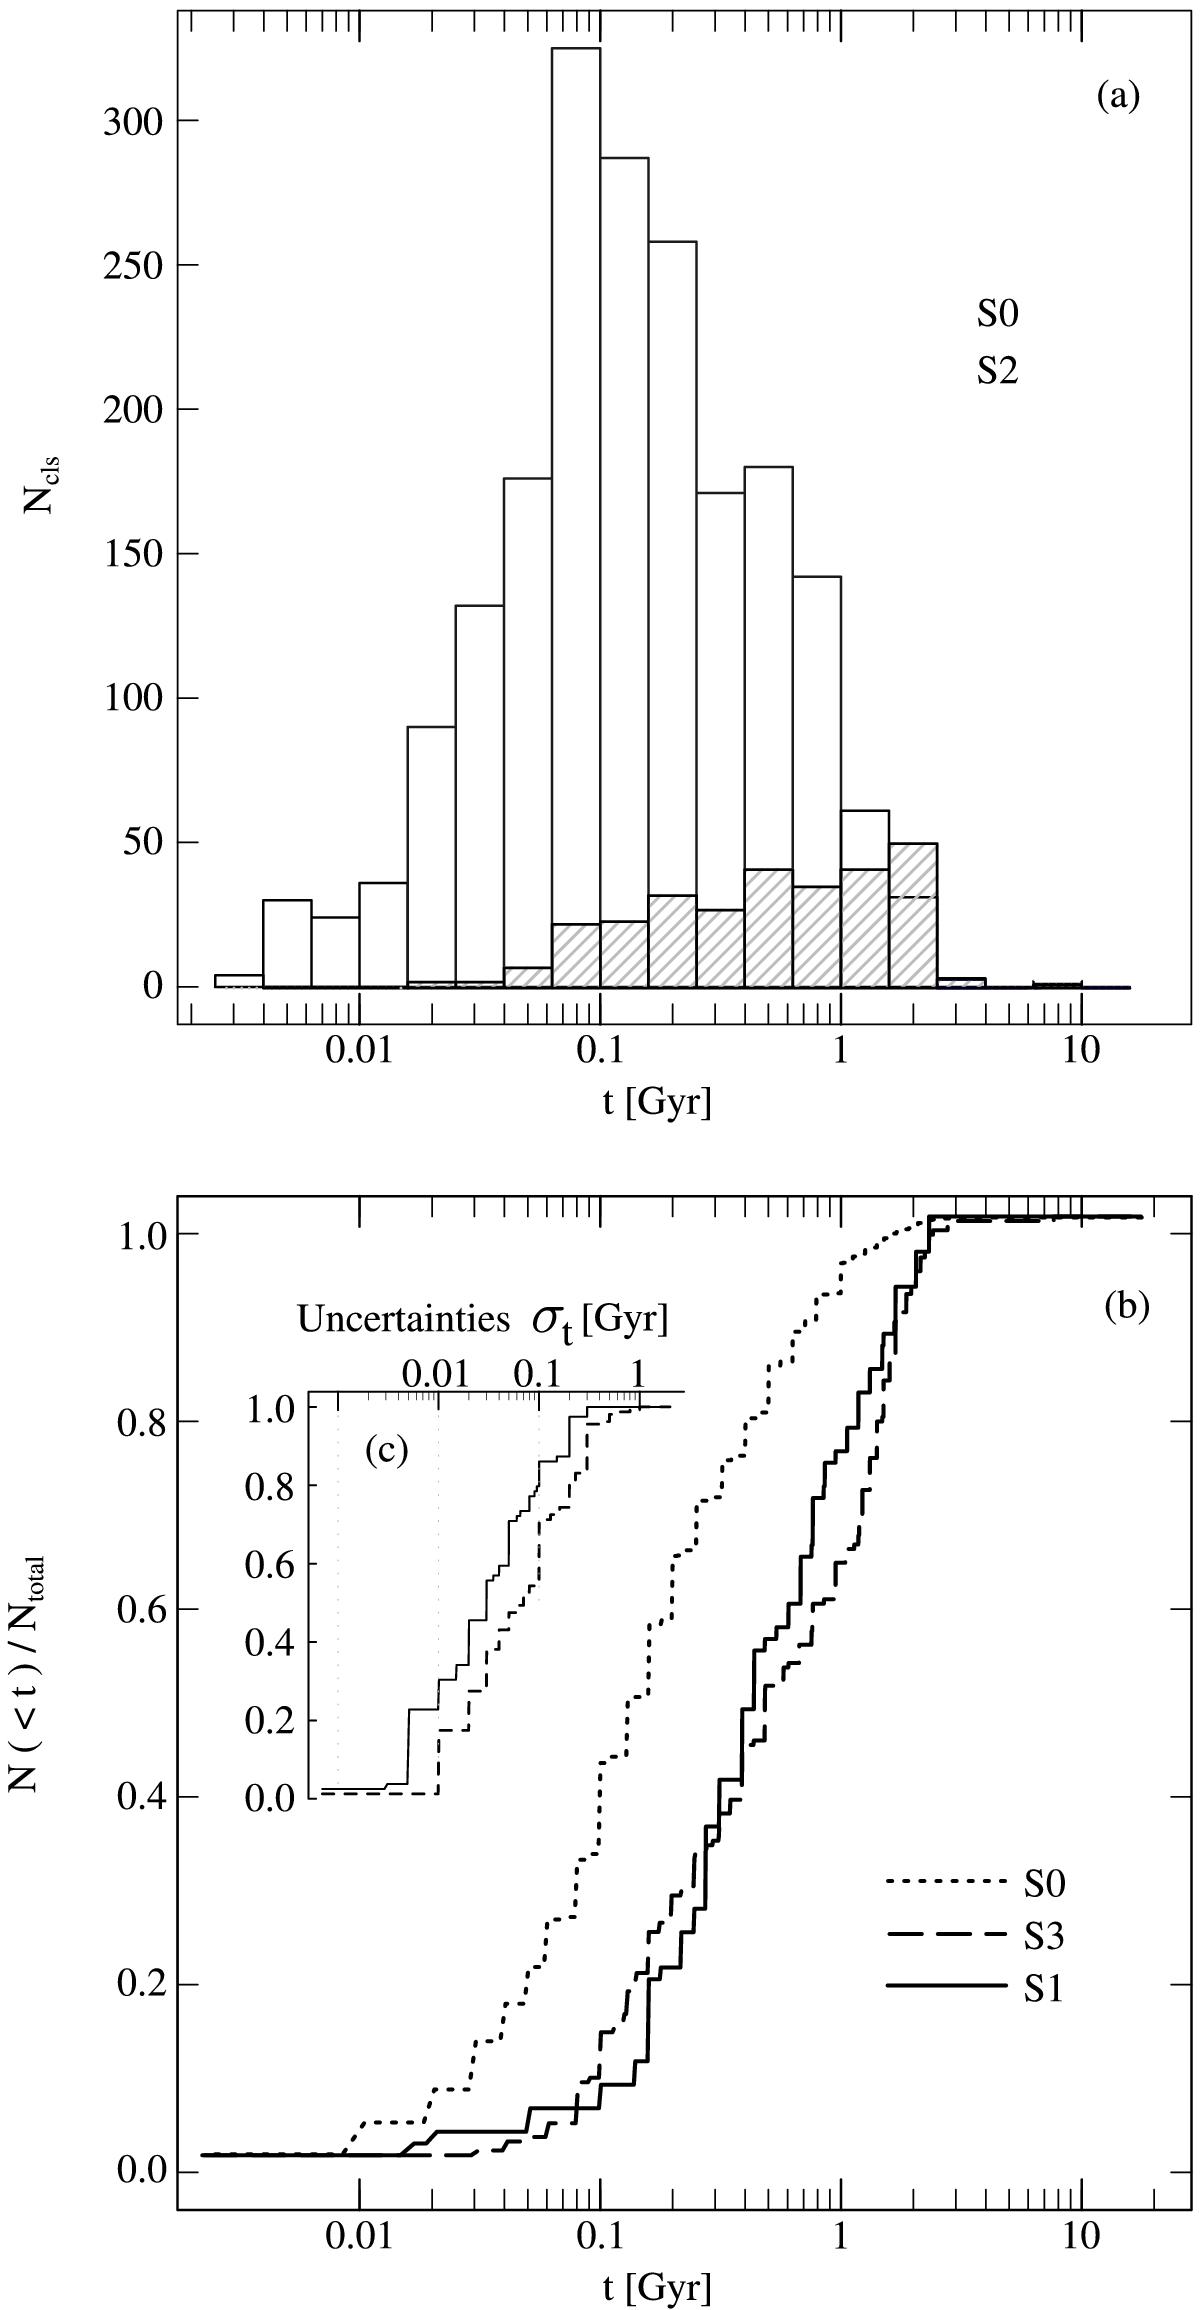
Panel a): histograms showing the age distributions obtained for the S0 (empty bars) and S2 (dashed bars) cluster samples. Panel b): age ECDFs for S1 (solid line), its complementary sample S3 (dashed line), and S0 (short dashed line) cluster samples. The cumulative distribution estimates of age uncertainties are also shown in the inset.
Current usage metrics show cumulative count of Article Views (full-text article views including HTML views, PDF and ePub downloads, according to the available data) and Abstracts Views on Vision4Press platform.
Data correspond to usage on the plateform after 2015. The current usage metrics is available 48-96 hours after online publication and is updated daily on week days.
Initial download of the metrics may take a while.