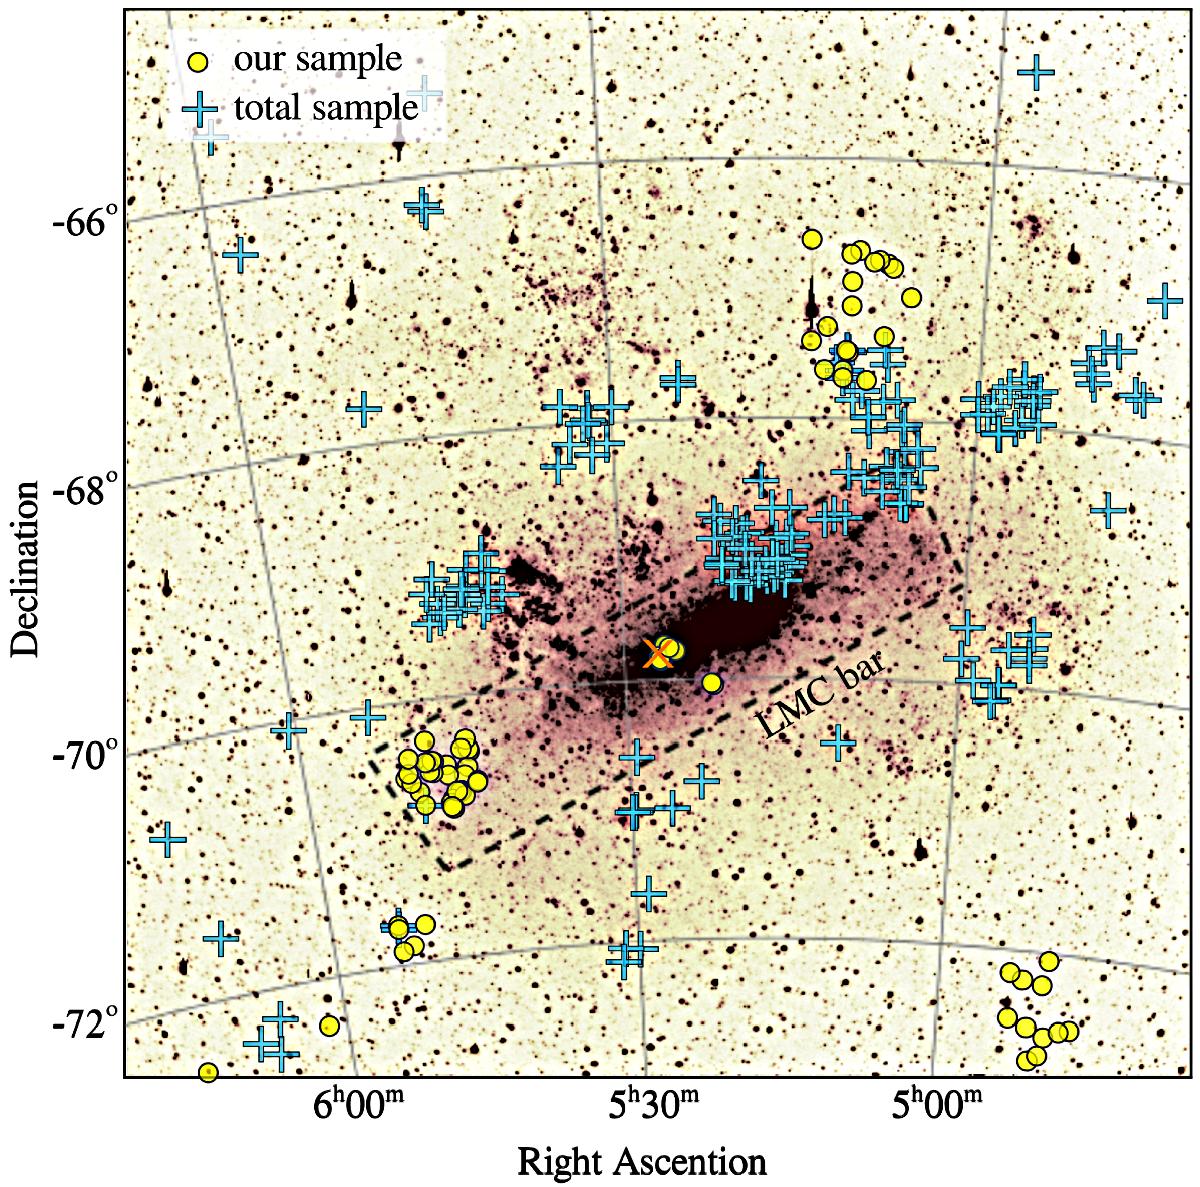
Fig. 1

Distribution map of the whole sample of star clusters studied in the Washington photometric system superimposed on the LMC galaxy image. Filled circles represent the clusters of our own sample, while plus signs stand for clusters studied by other authors using the same technique and analysis procedures. The cross indicates the geometrical centre of the bar (Bok 1966). The credits for the background image belongs to Bothun & Thompson (1988), Kennicutt et al. (1995) and Parker et al. (1998).
Current usage metrics show cumulative count of Article Views (full-text article views including HTML views, PDF and ePub downloads, according to the available data) and Abstracts Views on Vision4Press platform.
Data correspond to usage on the plateform after 2015. The current usage metrics is available 48-96 hours after online publication and is updated daily on week days.
Initial download of the metrics may take a while.


