Fig. 2
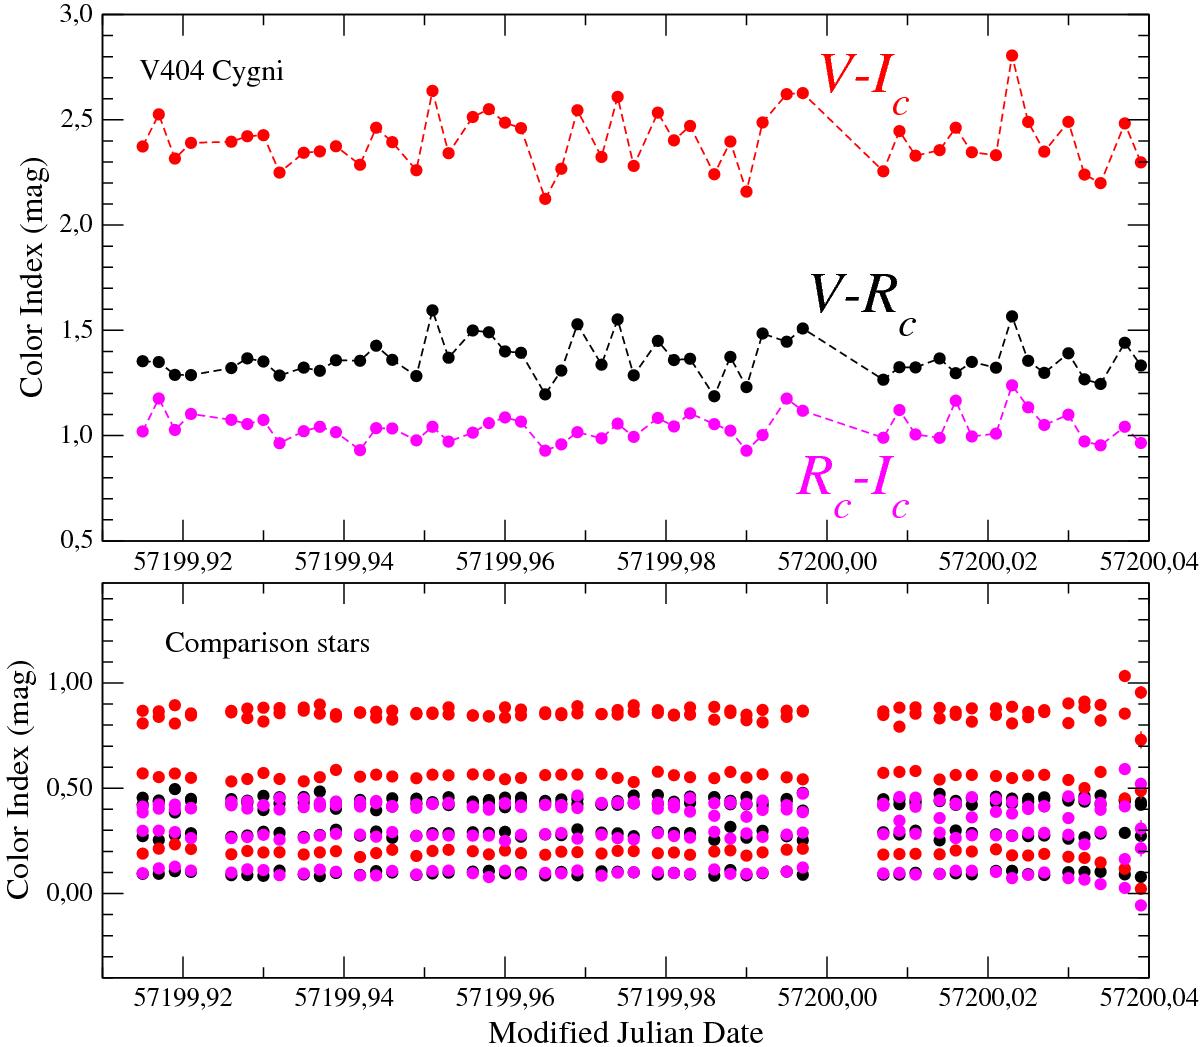
Top: variability of colour indices V − R, V − I and R − I of V404 Cygni in outburst as observed with the UJT on 26 June 2015. They are shown plotted in black, red, and magenta colours, respectively. Bottom: the same kind of plot for the four comparison stars plotted at the same scale. Their colours remained constant within 0.02–0.03 mag.
Current usage metrics show cumulative count of Article Views (full-text article views including HTML views, PDF and ePub downloads, according to the available data) and Abstracts Views on Vision4Press platform.
Data correspond to usage on the plateform after 2015. The current usage metrics is available 48-96 hours after online publication and is updated daily on week days.
Initial download of the metrics may take a while.