Free Access
Fig. 1
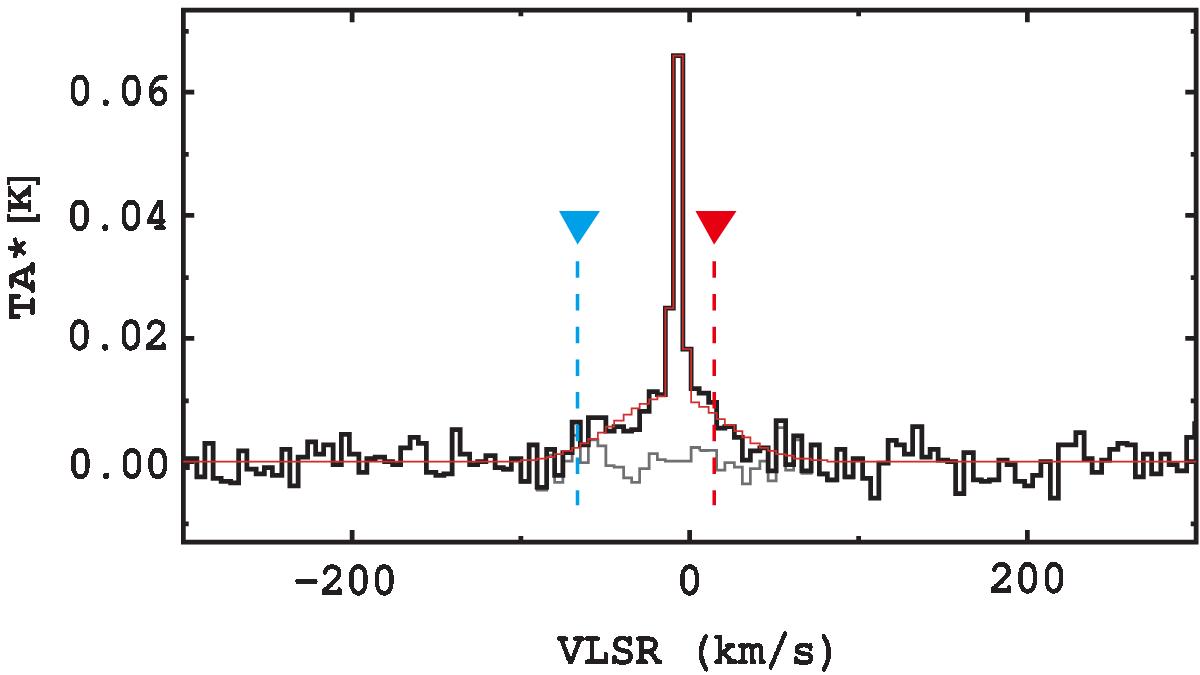
Four-channel binned spectrum of the SiO (2–1) emission in S235AB. Black lines show the observed data while the combined two-Gaussian model and its residuals are shown in red and grey, respectively. Blue and red triangles indicate extremum velocities of the H2O masers of Burns et al. (2015).
Current usage metrics show cumulative count of Article Views (full-text article views including HTML views, PDF and ePub downloads, according to the available data) and Abstracts Views on Vision4Press platform.
Data correspond to usage on the plateform after 2015. The current usage metrics is available 48-96 hours after online publication and is updated daily on week days.
Initial download of the metrics may take a while.