Free Access
Fig. 8
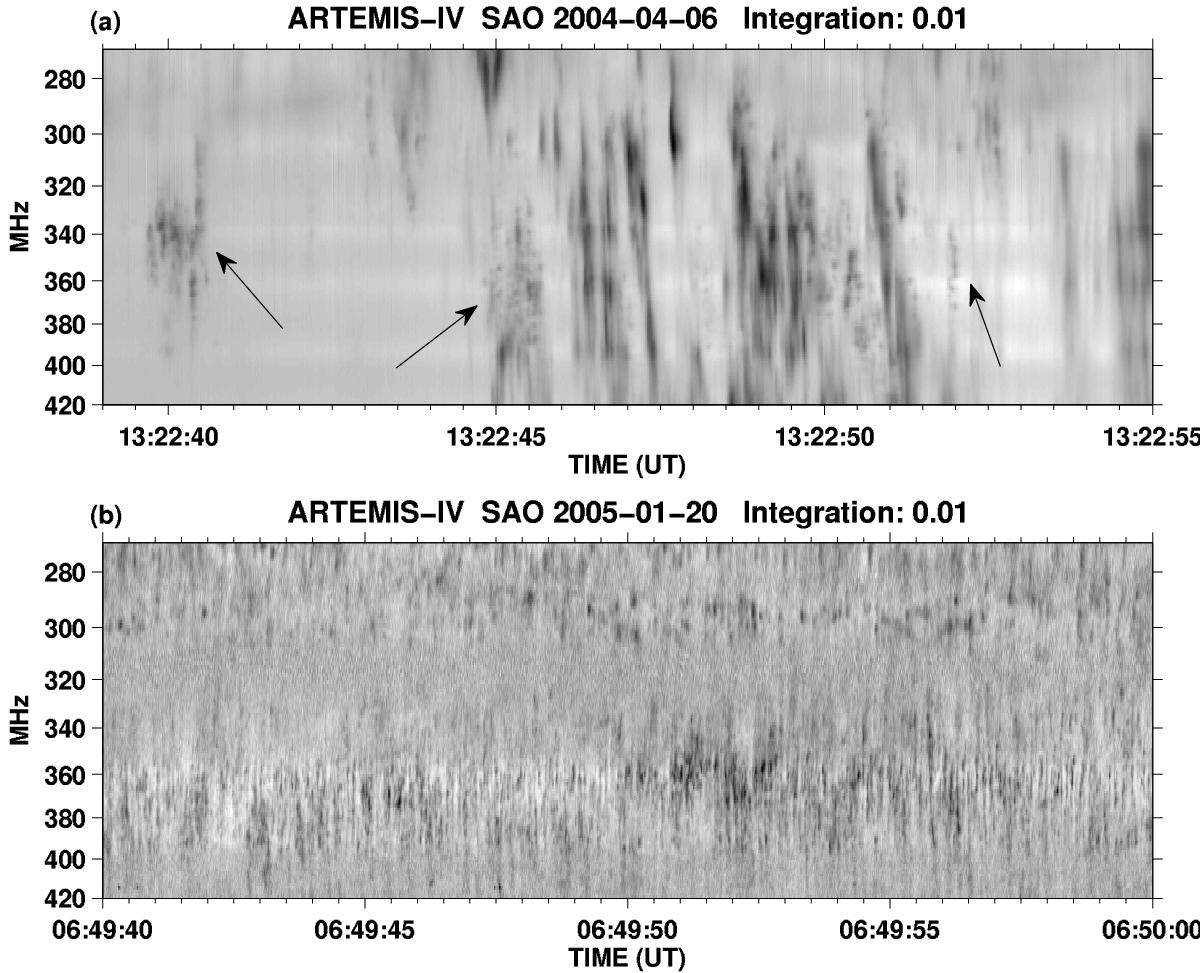
ARTEMIS/SAO high resolution (10 ms) dynamic spectra. a) Spike groups in time (columns). The arrows indicate some of these clusters. b) Spike groups in frequency (chains). There are two lanes of spikes in dynamic spectrum with 300 and 380 MHz central frequencies.
This figure is made of several images, please see below:
Current usage metrics show cumulative count of Article Views (full-text article views including HTML views, PDF and ePub downloads, according to the available data) and Abstracts Views on Vision4Press platform.
Data correspond to usage on the plateform after 2015. The current usage metrics is available 48-96 hours after online publication and is updated daily on week days.
Initial download of the metrics may take a while.