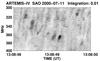
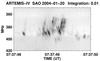
Fig. 7
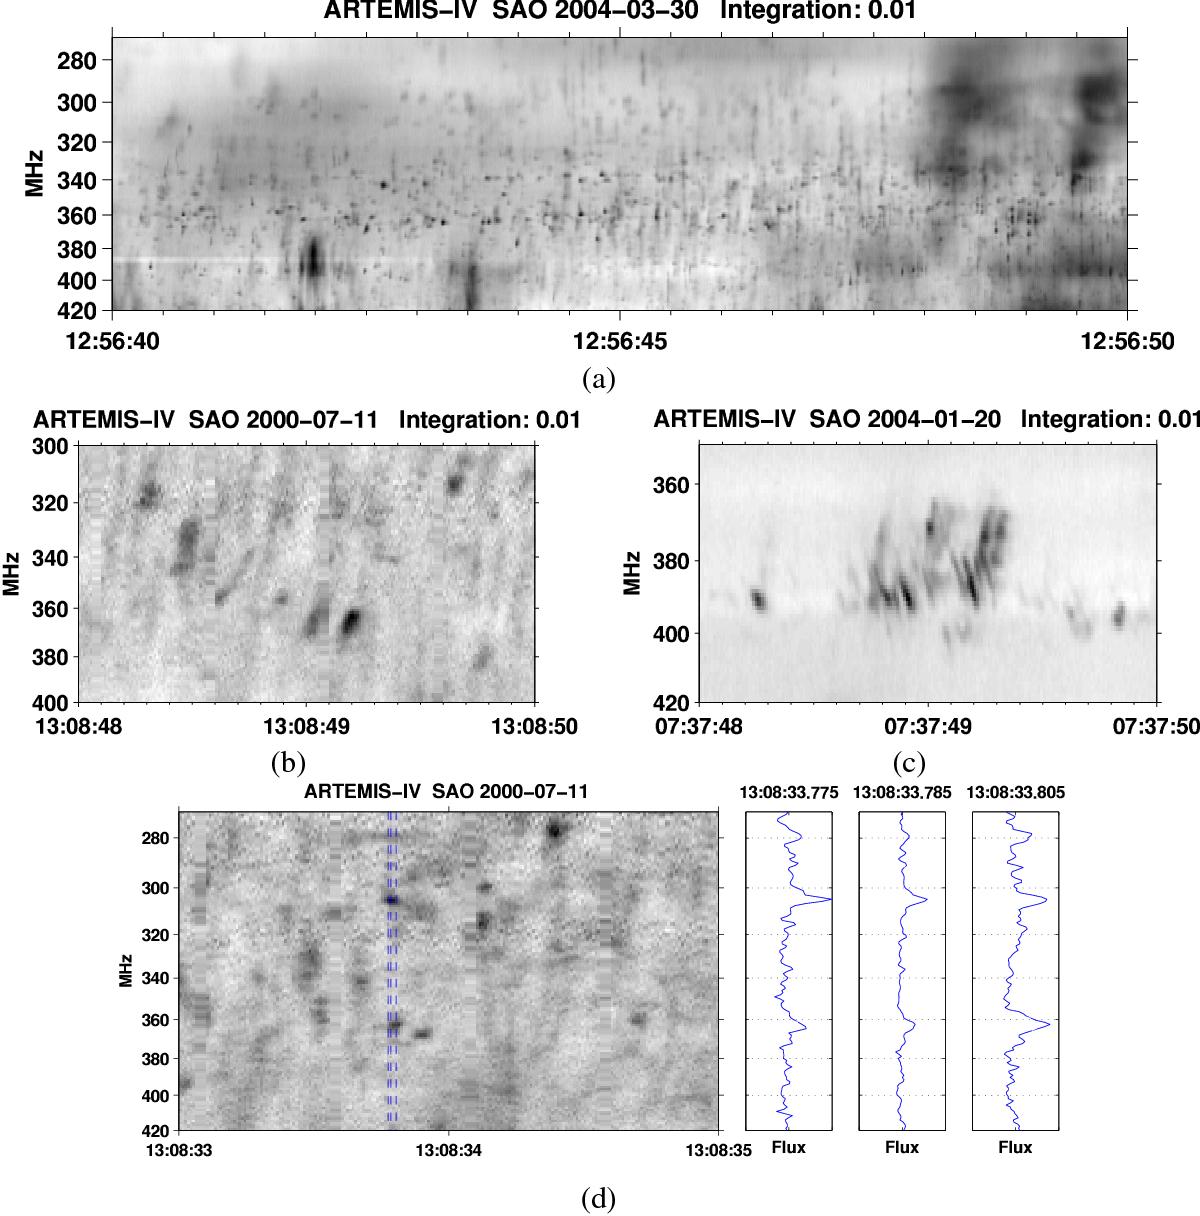
ARTEMIS/SAO high resolution (10 ms) dynamic spectra of drifting narrow-band structures. a) Spikes with different values of drift rates: positive, negative; and unmeasurable. b) Spikes with negative drifts; c) spikes with positive drifts; and d) spikes with unmeasurable drift rate. Plots in d) are spectral cuts along the lines marked in the dynamic spectrum.
Current usage metrics show cumulative count of Article Views (full-text article views including HTML views, PDF and ePub downloads, according to the available data) and Abstracts Views on Vision4Press platform.
Data correspond to usage on the plateform after 2015. The current usage metrics is available 48-96 hours after online publication and is updated daily on week days.
Initial download of the metrics may take a while.