Fig. 6
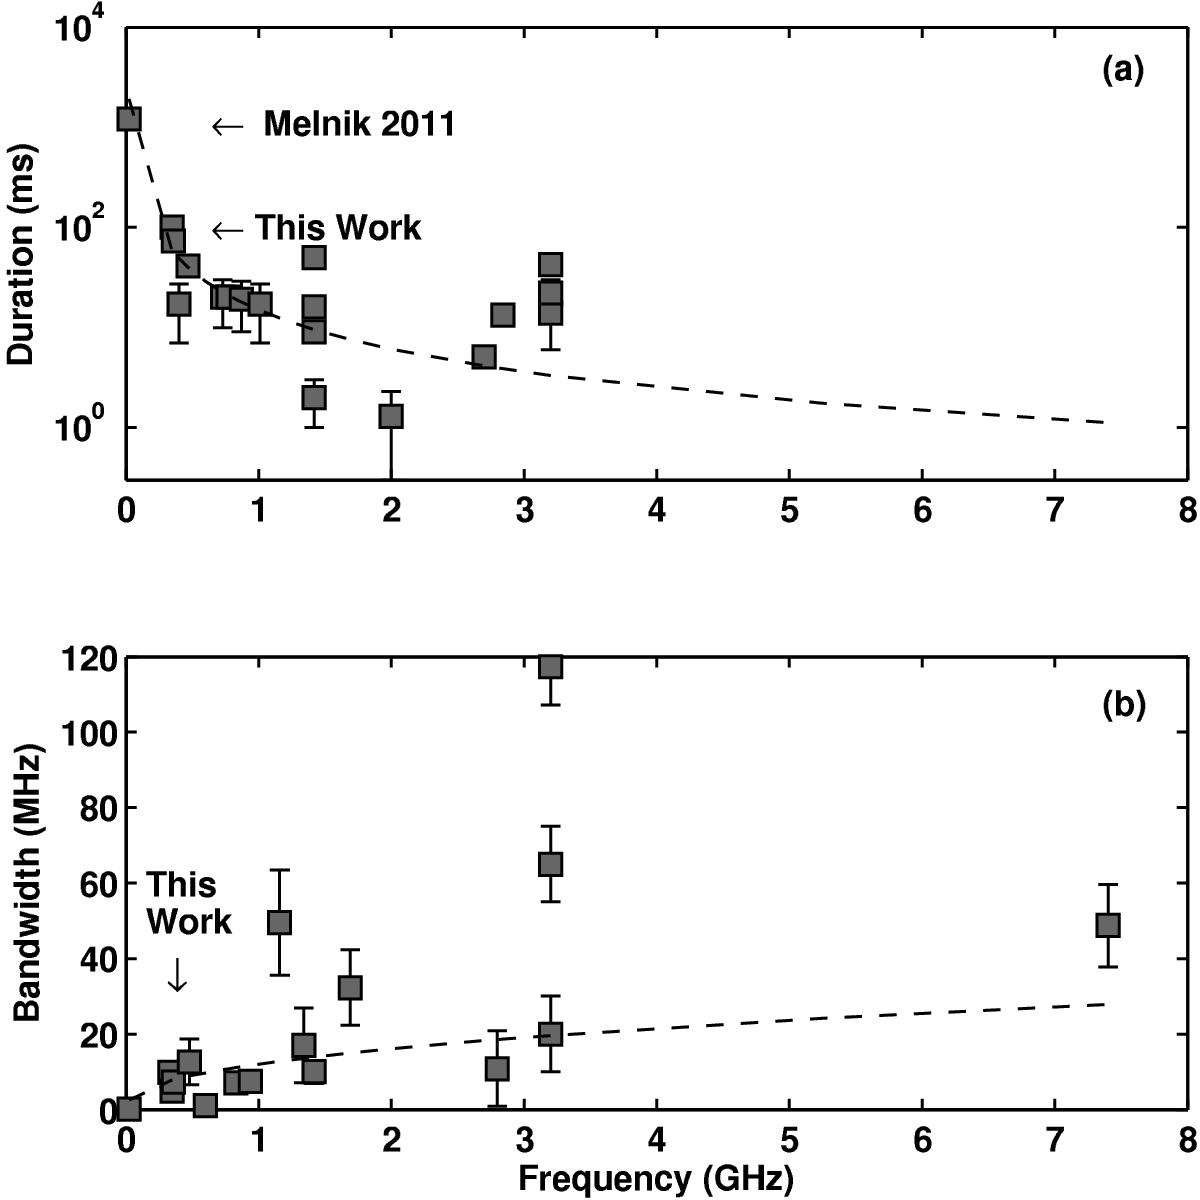
Panel a): duration of narrow-band bursts and spikes as a function of frequency of observation. The dashed lines represents the empirical power law fit (dt ∝ f-1.3), (Guedel & Benz 1990; Mészárosová et al. 2003; Rozhansky et al. 2008). Panel b): instantaneous bandwidth versus frequency; the line is a plot of the empirical power law fit Df ∝ 0.66f0.42 by Csillaghy & Benz (1993).
Current usage metrics show cumulative count of Article Views (full-text article views including HTML views, PDF and ePub downloads, according to the available data) and Abstracts Views on Vision4Press platform.
Data correspond to usage on the plateform after 2015. The current usage metrics is available 48-96 hours after online publication and is updated daily on week days.
Initial download of the metrics may take a while.