Free Access
Fig. 17
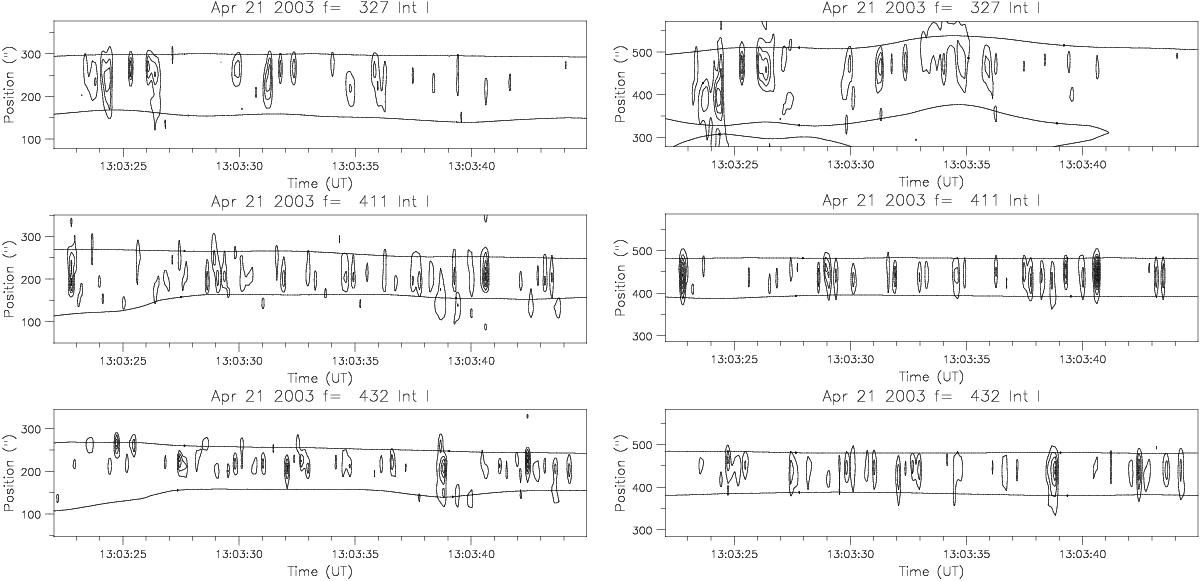
Contour plots of 1D intensity vs. time after a high-pass filtering in time, from the EW (left column) and the NS (right column) NRH arrays. The two lines along the time axis indicate the width of the background component.
This figure is made of several images, please see below:
Current usage metrics show cumulative count of Article Views (full-text article views including HTML views, PDF and ePub downloads, according to the available data) and Abstracts Views on Vision4Press platform.
Data correspond to usage on the plateform after 2015. The current usage metrics is available 48-96 hours after online publication and is updated daily on week days.
Initial download of the metrics may take a while.