Free Access
Fig. 16
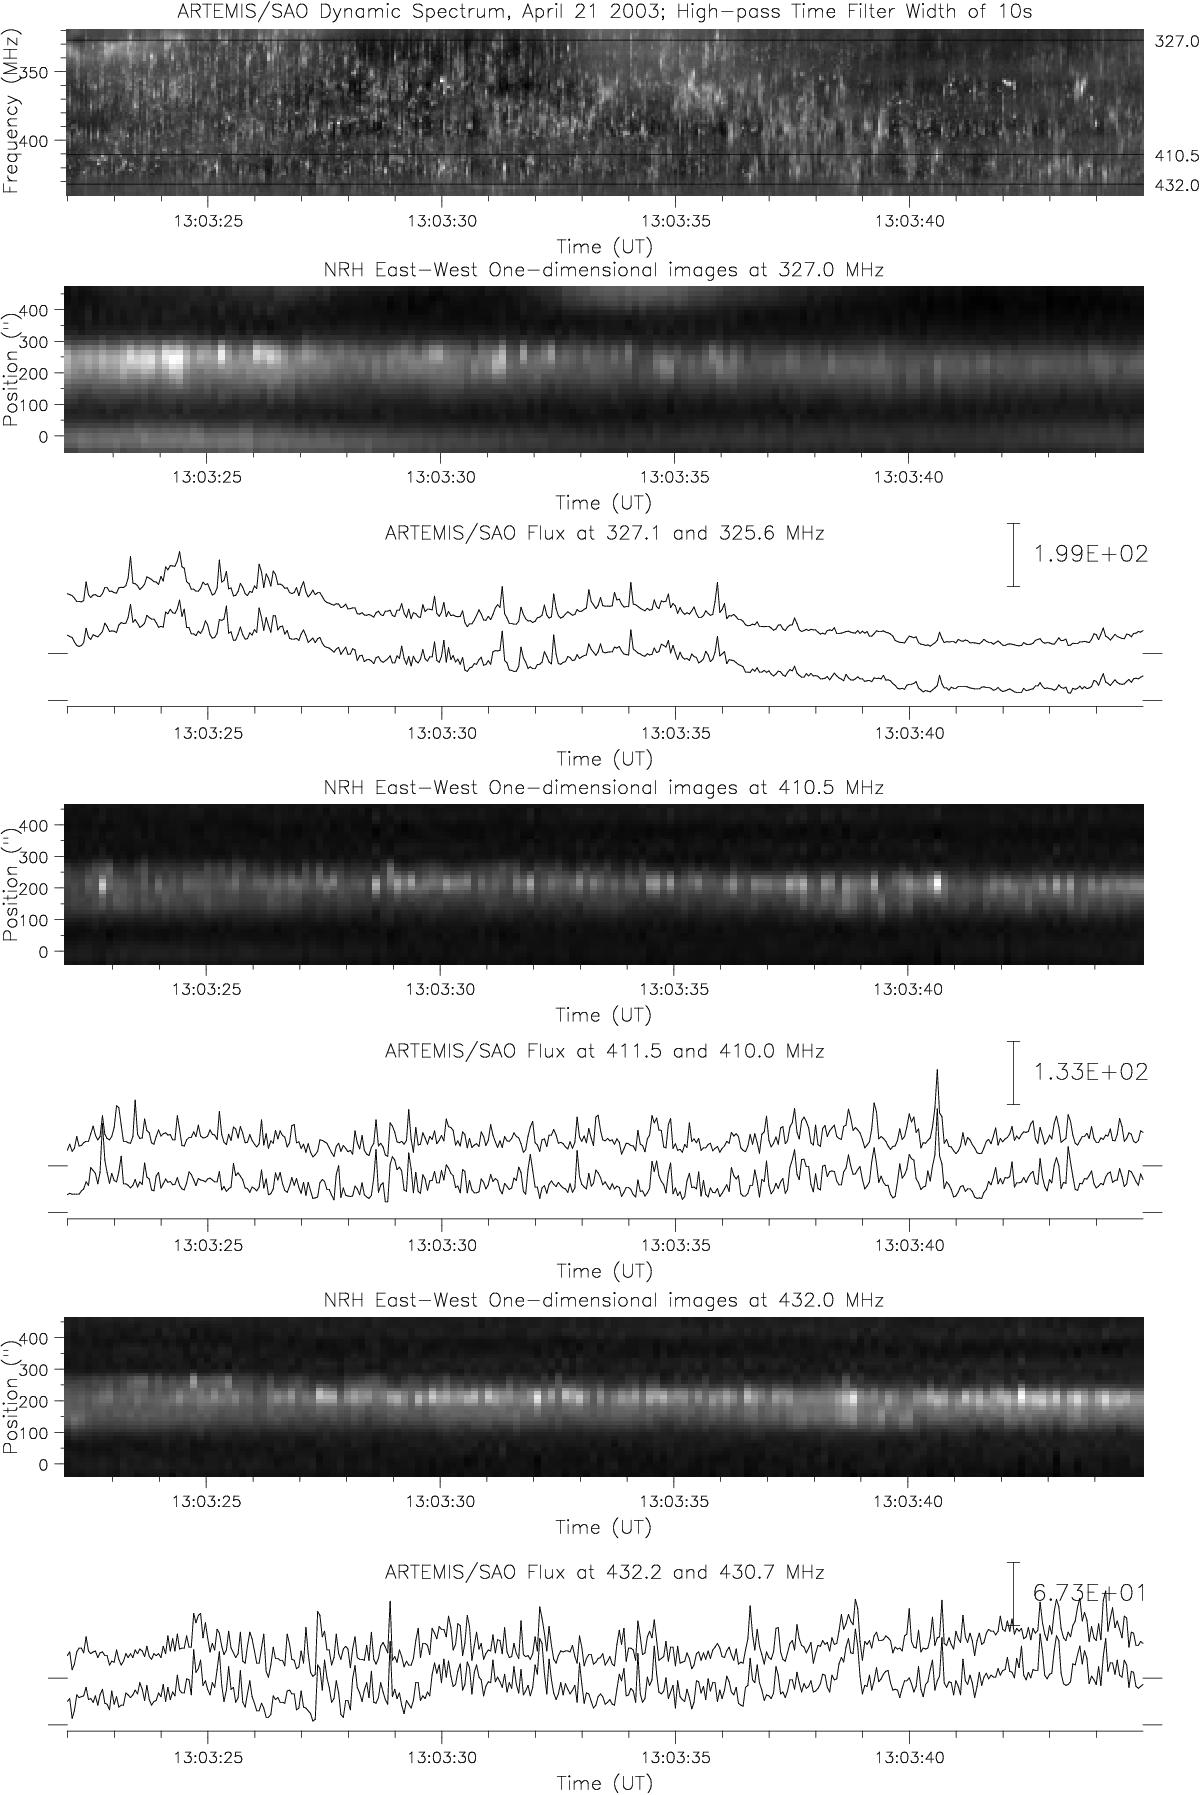
Top rows: SAO dynamic spectrum. The position of the frequencies of the NRH are marked on the right. EW one-dimensional NRH images at 327 MHz as a function of time. SAO time profiles at 327.1 and 325.6 MHz; the bar gives the intensity scale in arbitrary units. Other rows: same for 410.5 and 432 MHz
Current usage metrics show cumulative count of Article Views (full-text article views including HTML views, PDF and ePub downloads, according to the available data) and Abstracts Views on Vision4Press platform.
Data correspond to usage on the plateform after 2015. The current usage metrics is available 48-96 hours after online publication and is updated daily on week days.
Initial download of the metrics may take a while.