Free Access
Fig. 15
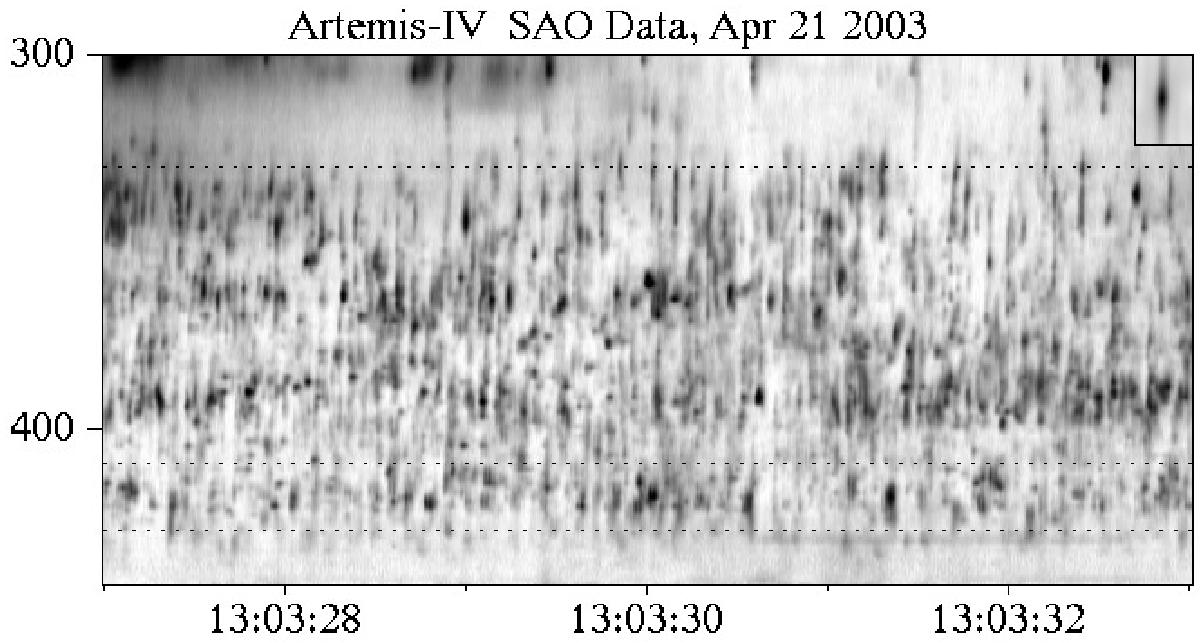
SAO dynamic spectrum of spikes during a six-second interval at full time resolution (10 ms). Dotted lines mark the frequencies of NRH data at 327.0, 410.5, and 432.0 MHz. The insert in the top right corner shows the autocorrelation function.
Current usage metrics show cumulative count of Article Views (full-text article views including HTML views, PDF and ePub downloads, according to the available data) and Abstracts Views on Vision4Press platform.
Data correspond to usage on the plateform after 2015. The current usage metrics is available 48-96 hours after online publication and is updated daily on week days.
Initial download of the metrics may take a while.