Free Access
Fig. 14
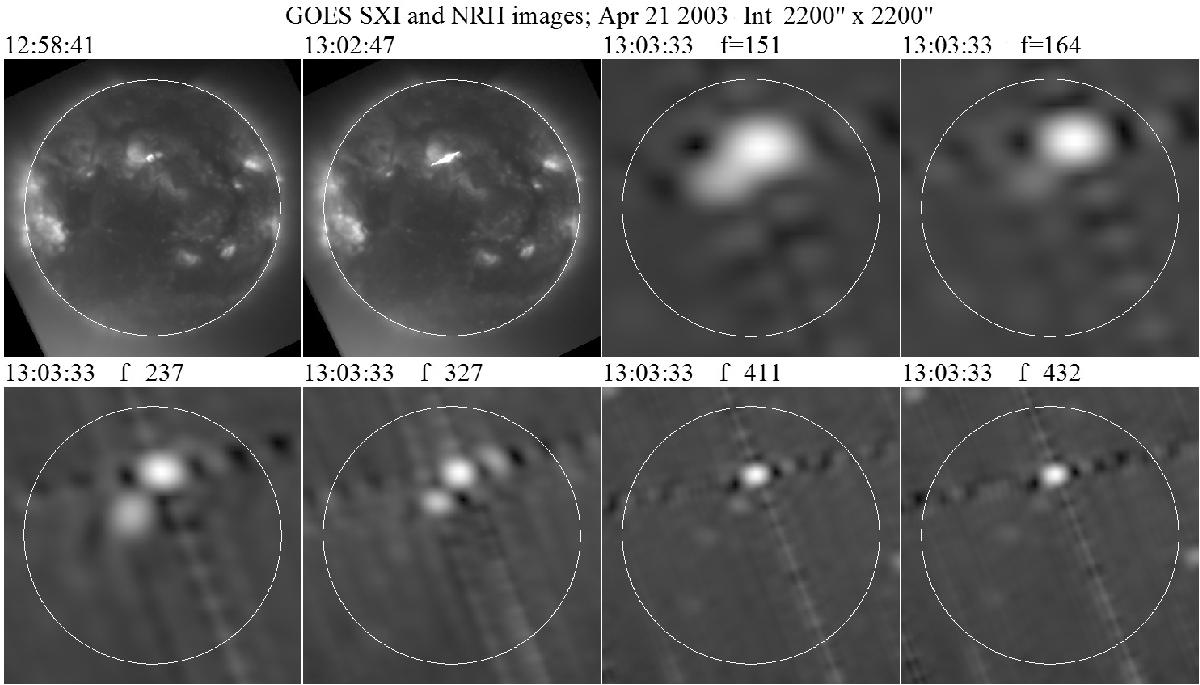
GOES/SXI images before and during the early phase of the flare and NRH images averaged over 23 s during an interval of spike activity. The white circle marks the photospheric limb. All images are oriented in the solar E-W, N-S direction.
Current usage metrics show cumulative count of Article Views (full-text article views including HTML views, PDF and ePub downloads, according to the available data) and Abstracts Views on Vision4Press platform.
Data correspond to usage on the plateform after 2015. The current usage metrics is available 48-96 hours after online publication and is updated daily on week days.
Initial download of the metrics may take a while.