Fig. 8
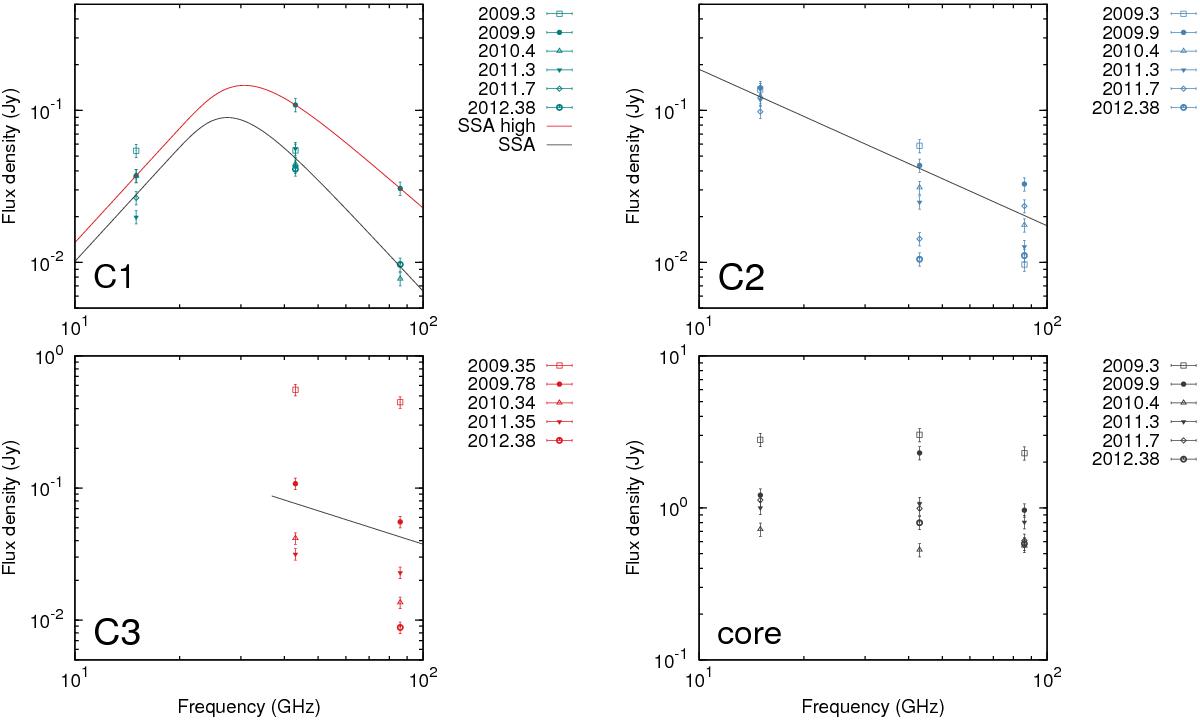
Three-point spectra of knots C1, C2, the VLBI core, and their temporal evolution. For C3 spectra are only available at 43 GHz and 86 GHz since it is blended at 15 GHz. Black lines represent the time-averaged spectra of components, and their slopes are reported in Table 7. For component C1 the fitted SSA model spectra are also shown. The red curve is an SSA fit during its highest state, while the black curve corresponds to the mean SSA spectrum.
Current usage metrics show cumulative count of Article Views (full-text article views including HTML views, PDF and ePub downloads, according to the available data) and Abstracts Views on Vision4Press platform.
Data correspond to usage on the plateform after 2015. The current usage metrics is available 48-96 hours after online publication and is updated daily on week days.
Initial download of the metrics may take a while.