Fig. 3
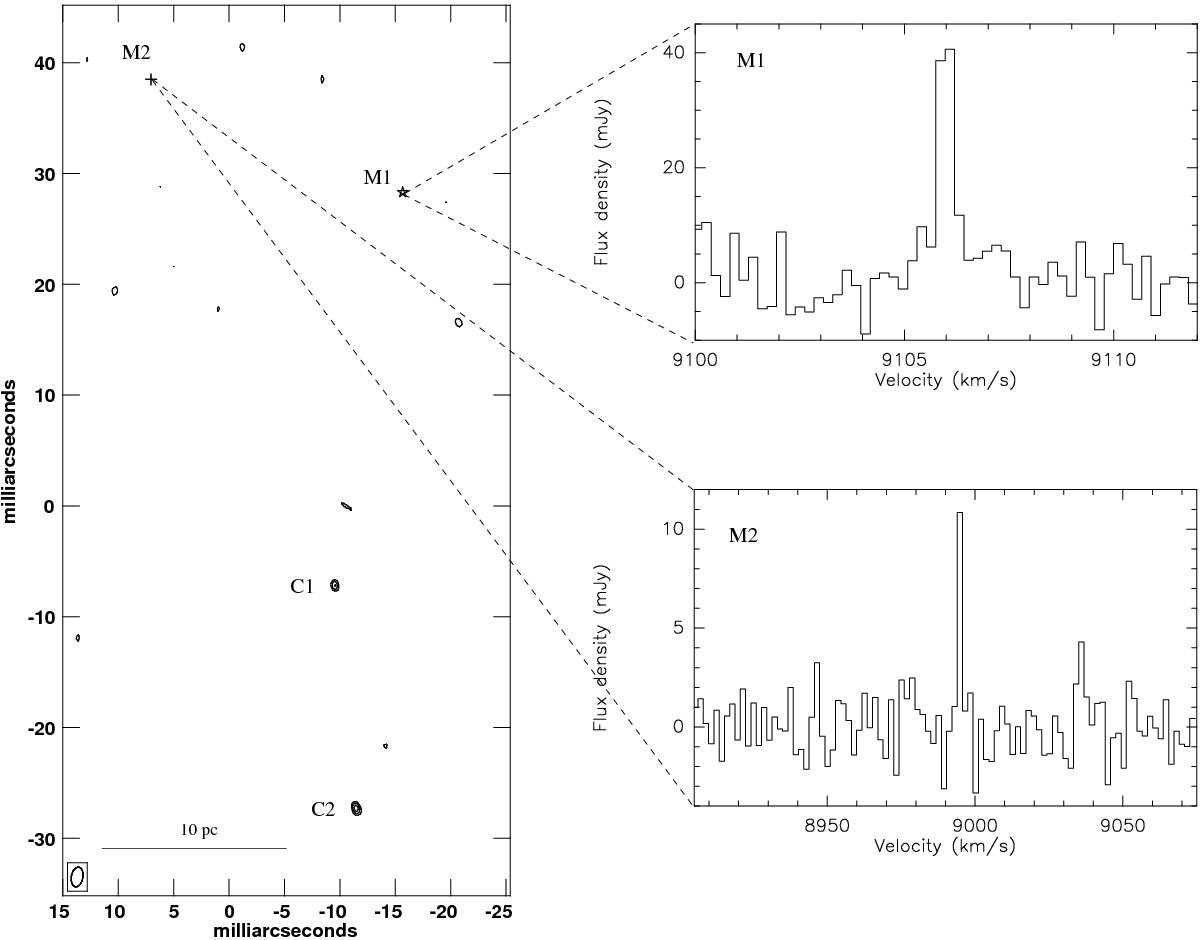
Left panel: 22 GHz VLBA contour map of the radio continuum emission from the nucleus of IRAS 15480. Contour levels are 4, 5, 6, 7 × 0.1 mJy/beam. The star indicates the position of the brightest maser spot (M1) at v = 9106 km s-1, while the plus sign marks the position of the weaker maser feature (M2) with a velocity of 8994 km s-1. The positions are plotted relative to the centre of the map (i.e. the position of the optical nucleus of IRAS 15480). Top right panel: VLBA spectrum of the brightest maser spot M1. The channel spacing is 0.2 km s-1. Bottom right panel: VLBA spectrum of the blueshifted maser feature M2. The channel spacing is 1.8 km s-1.
Current usage metrics show cumulative count of Article Views (full-text article views including HTML views, PDF and ePub downloads, according to the available data) and Abstracts Views on Vision4Press platform.
Data correspond to usage on the plateform after 2015. The current usage metrics is available 48-96 hours after online publication and is updated daily on week days.
Initial download of the metrics may take a while.