Fig. 2
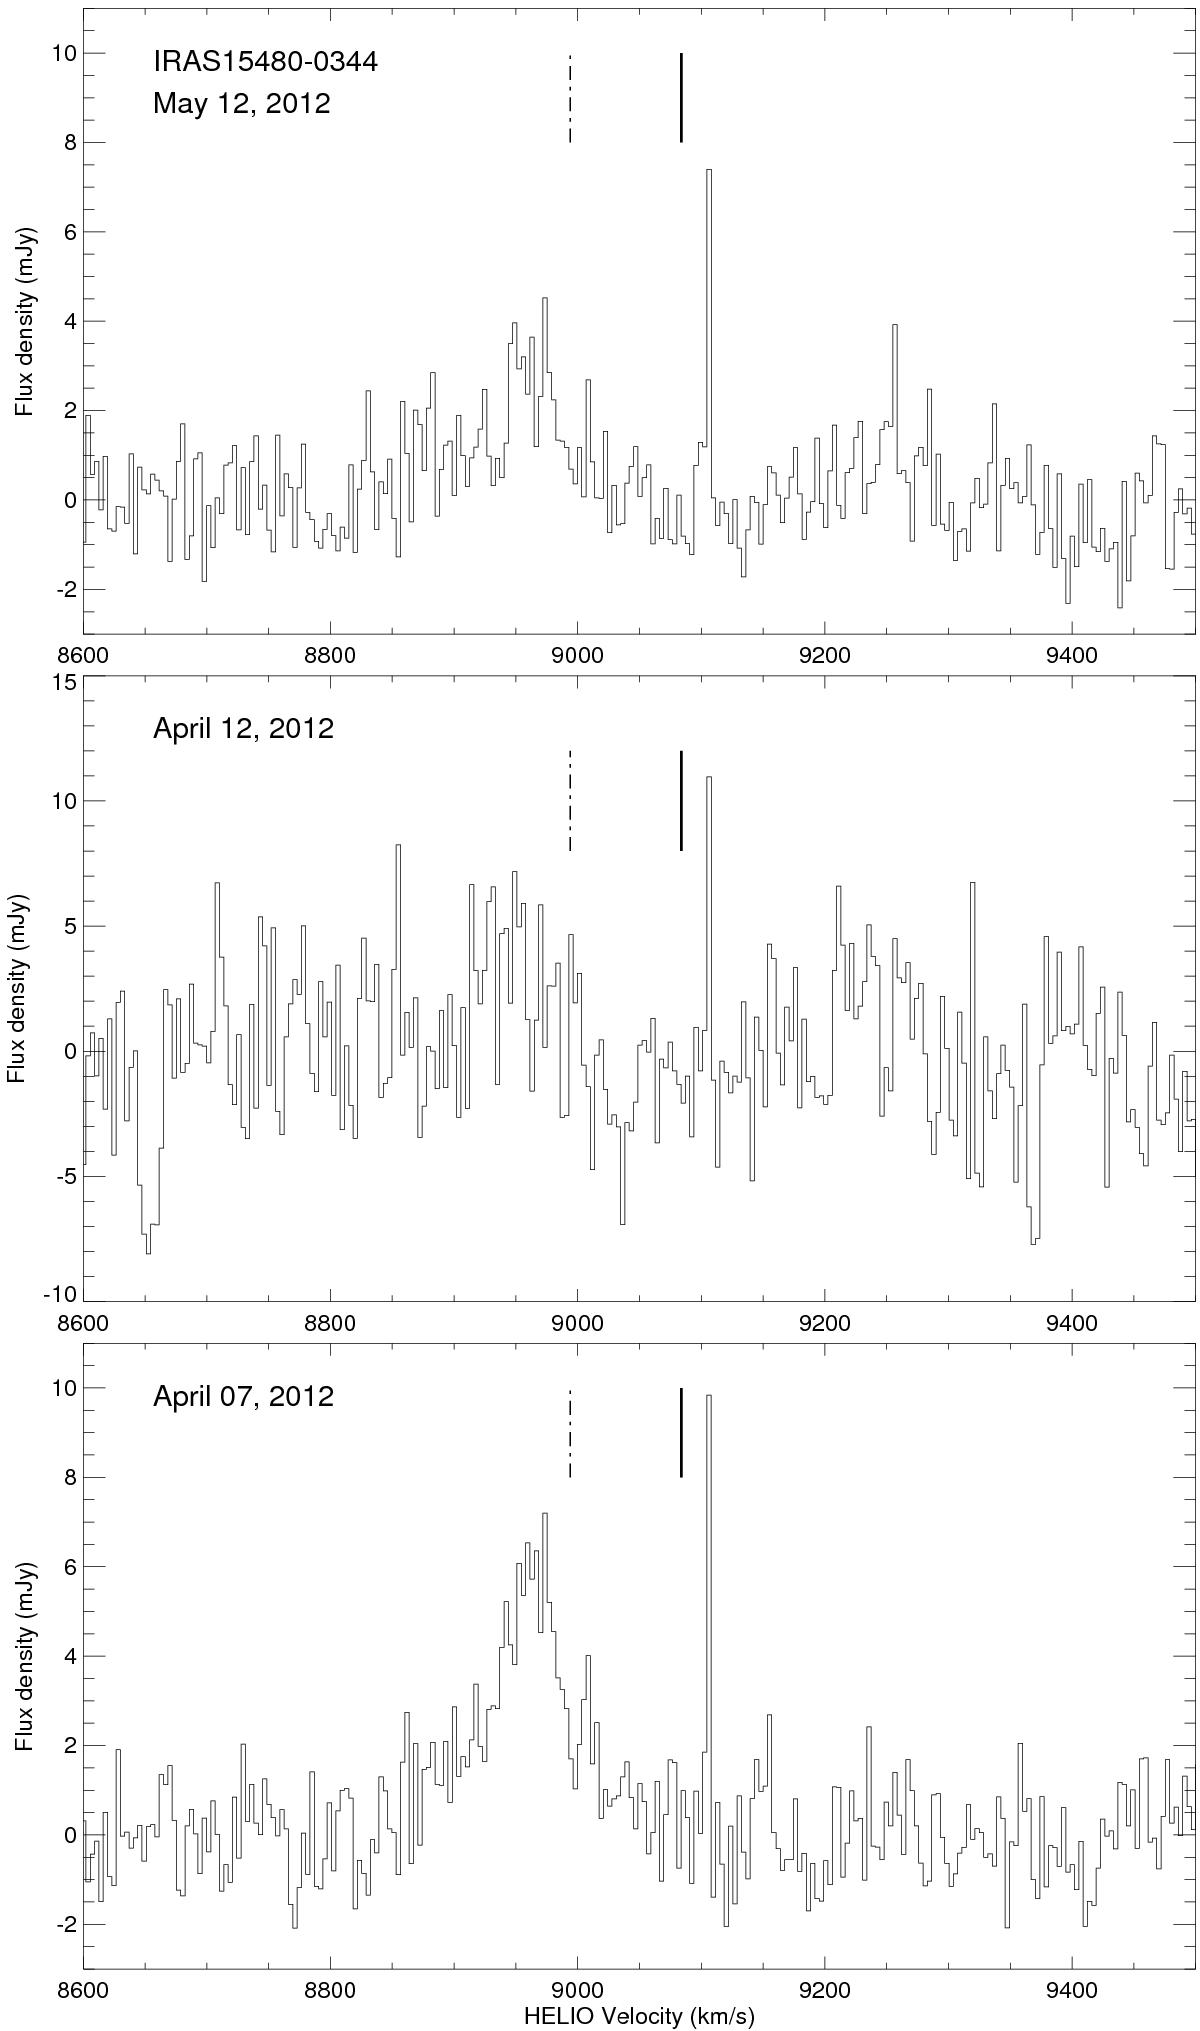
H2O maser spectra observed towards IRAS 15480-0344 with the GBT on April 7 (bottom panel), April 12 (middle panel), and May 12, 2012 (top panel). Channel spacing is 3.3 km s-1. The vertical line indicates the recessional velocity of the galaxy. The dash-dotted line marks the velocity of the maser spot M2, detected with the VLBA (Sect. 4.2). The velocity scale is with respect to the heliocentric frame and uses the optical convention.
Current usage metrics show cumulative count of Article Views (full-text article views including HTML views, PDF and ePub downloads, according to the available data) and Abstracts Views on Vision4Press platform.
Data correspond to usage on the plateform after 2015. The current usage metrics is available 48-96 hours after online publication and is updated daily on week days.
Initial download of the metrics may take a while.