Fig. 2
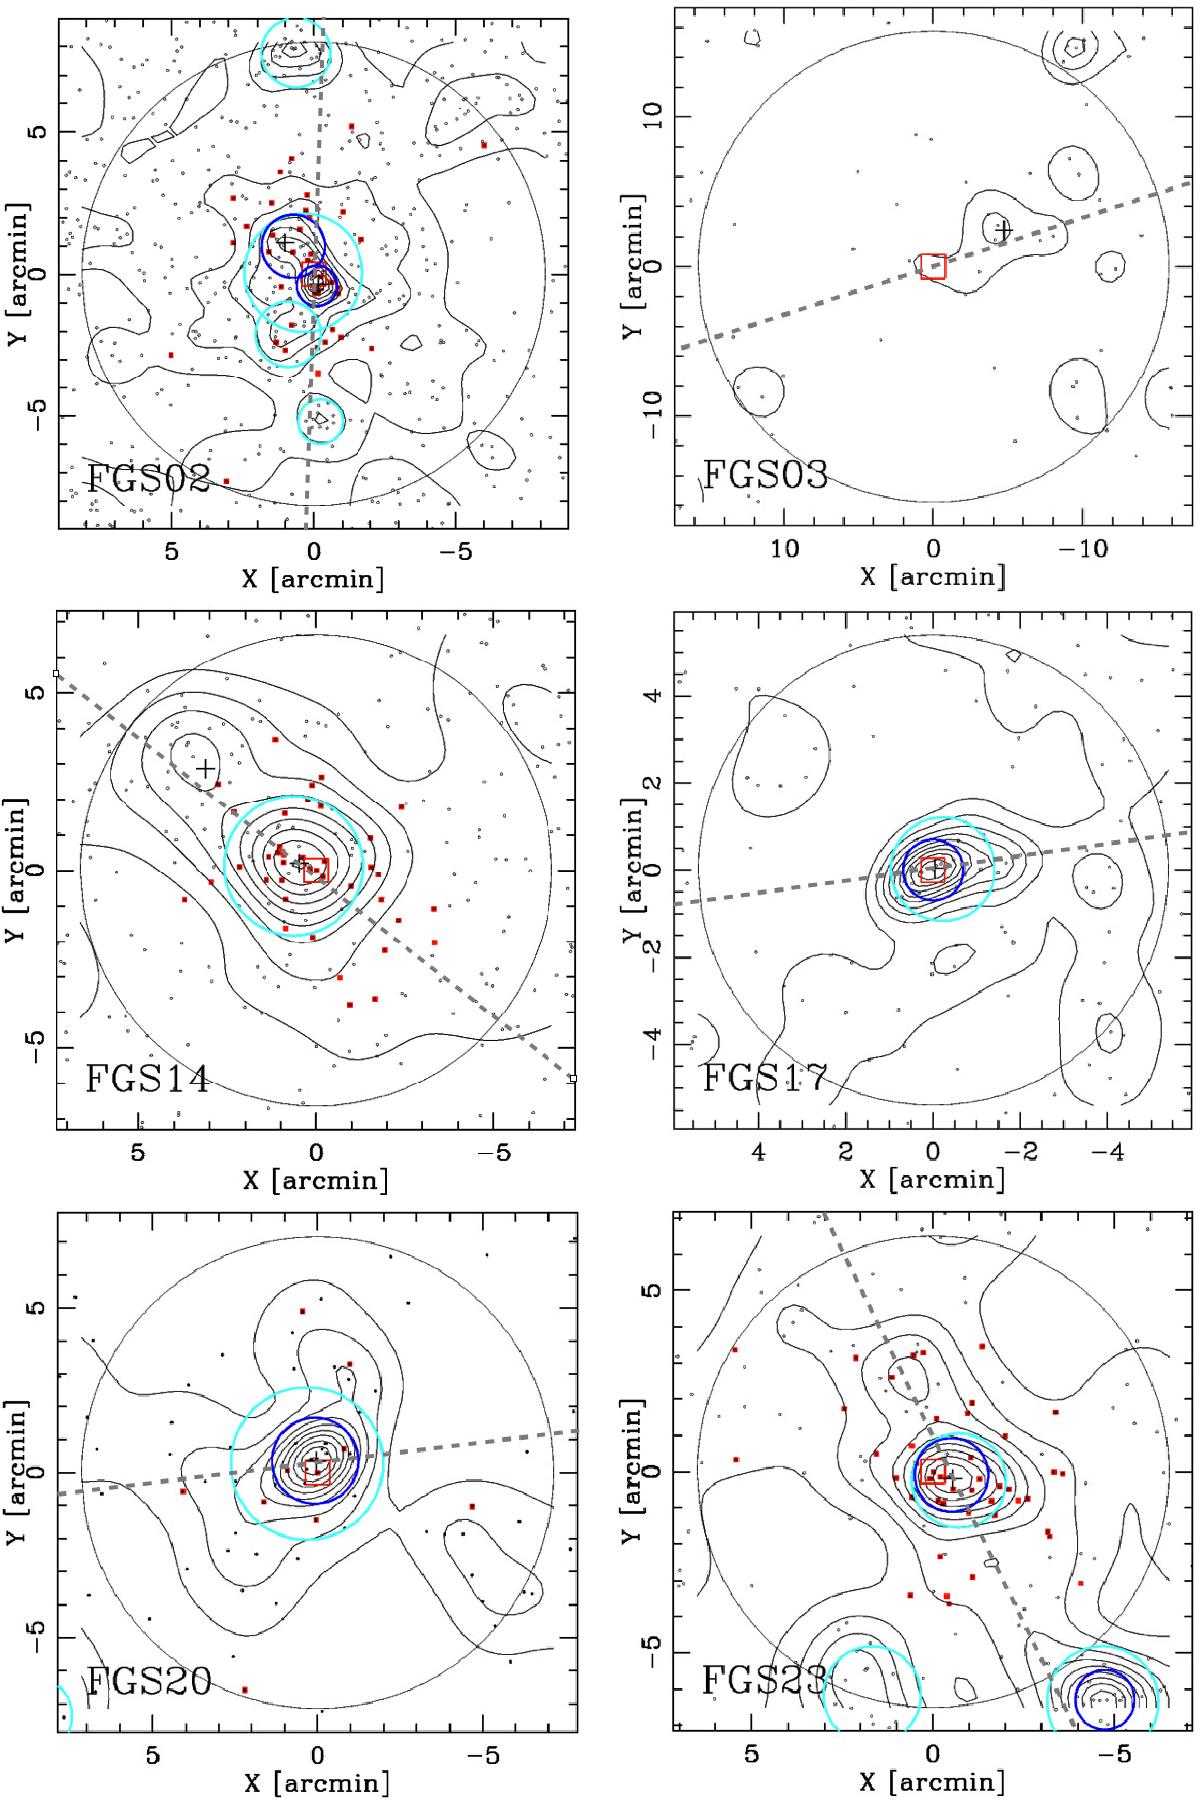
2D-DEDICA contours (black) as obtained by the analysis of the substructures within 2 R200 for the FGs in our sample. Black points are galaxies; red squares represent spectroscopically-confirmed members; and, in particular, large open squares indicate the position of the BGGs. The black crosses are the centers of the significant peaks identified by 2D-DEDICA within R200, which position is reported in Table 3. Superimposed, blue circles are the peaks at 99.9% c.l. and cyan circles are the peaks at 99% c.l. as detected from the Voronoi procedure. The black circles are the R200 radius. The gray dotted lines represent the PA of each system, as reported in Table 4.
Current usage metrics show cumulative count of Article Views (full-text article views including HTML views, PDF and ePub downloads, according to the available data) and Abstracts Views on Vision4Press platform.
Data correspond to usage on the plateform after 2015. The current usage metrics is available 48-96 hours after online publication and is updated daily on week days.
Initial download of the metrics may take a while.