Free Access
Fig. 1
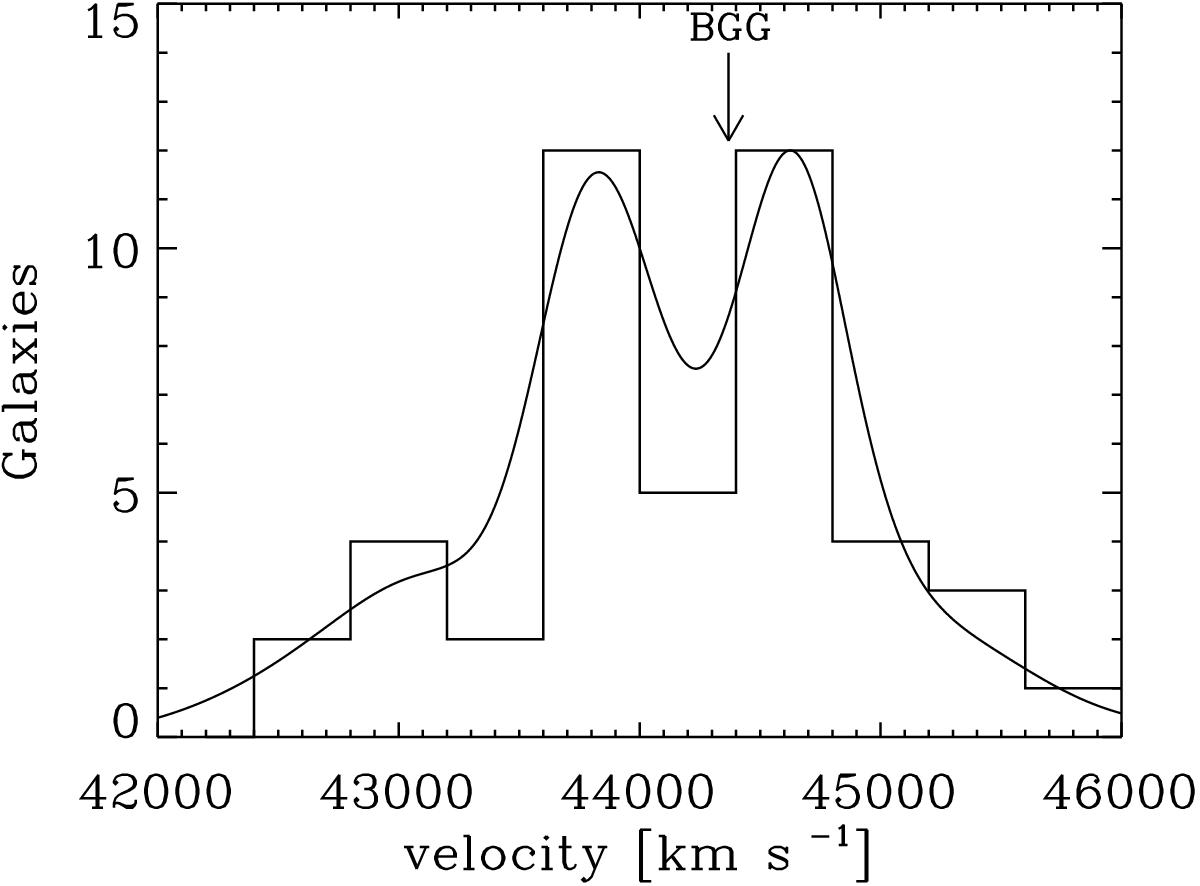
Velocity histogram of FGS23. The curve represents the density reconstruction according to the 1D-DEDICA method. The vertical arrow indicates the velocity of the BGG.
Current usage metrics show cumulative count of Article Views (full-text article views including HTML views, PDF and ePub downloads, according to the available data) and Abstracts Views on Vision4Press platform.
Data correspond to usage on the plateform after 2015. The current usage metrics is available 48-96 hours after online publication and is updated daily on week days.
Initial download of the metrics may take a while.