Fig. 9
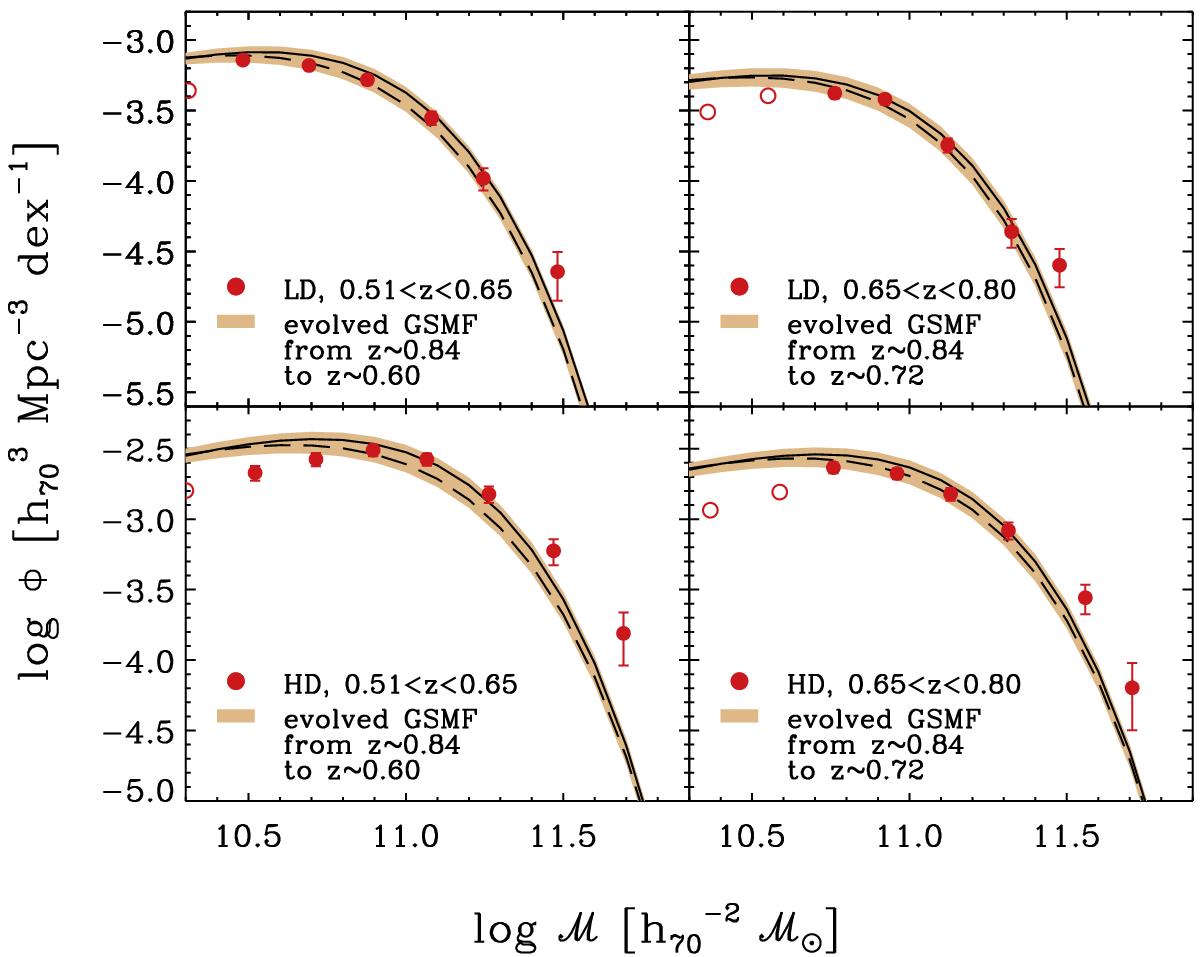
Comparison between the GSMFs constructed with the P10 recipe and the VIPERS data. In each panel, red filled circles indicate the 1 /Vmax points (with Poissonian errors) of the VIPERS passive mass function in the redshift bin and environment indicated in the legend. Lines and shaded areas represent the evolution of the GSMF observed at 0.8 <z< 0.9, down to the same redshift as the plotted data points. Applying the quenching description of P10, we obtain two different estimates if we use the original sSFR(z,ℳ) parametrisation of P10 (solid line) or the function provided in Speagle et al. (2014, dashed line). Another error is introduced to account for the uncertainties in the integration (see Eq. (6)), giving the final width of the shaded area.
Current usage metrics show cumulative count of Article Views (full-text article views including HTML views, PDF and ePub downloads, according to the available data) and Abstracts Views on Vision4Press platform.
Data correspond to usage on the plateform after 2015. The current usage metrics is available 48-96 hours after online publication and is updated daily on week days.
Initial download of the metrics may take a while.