Fig. 8
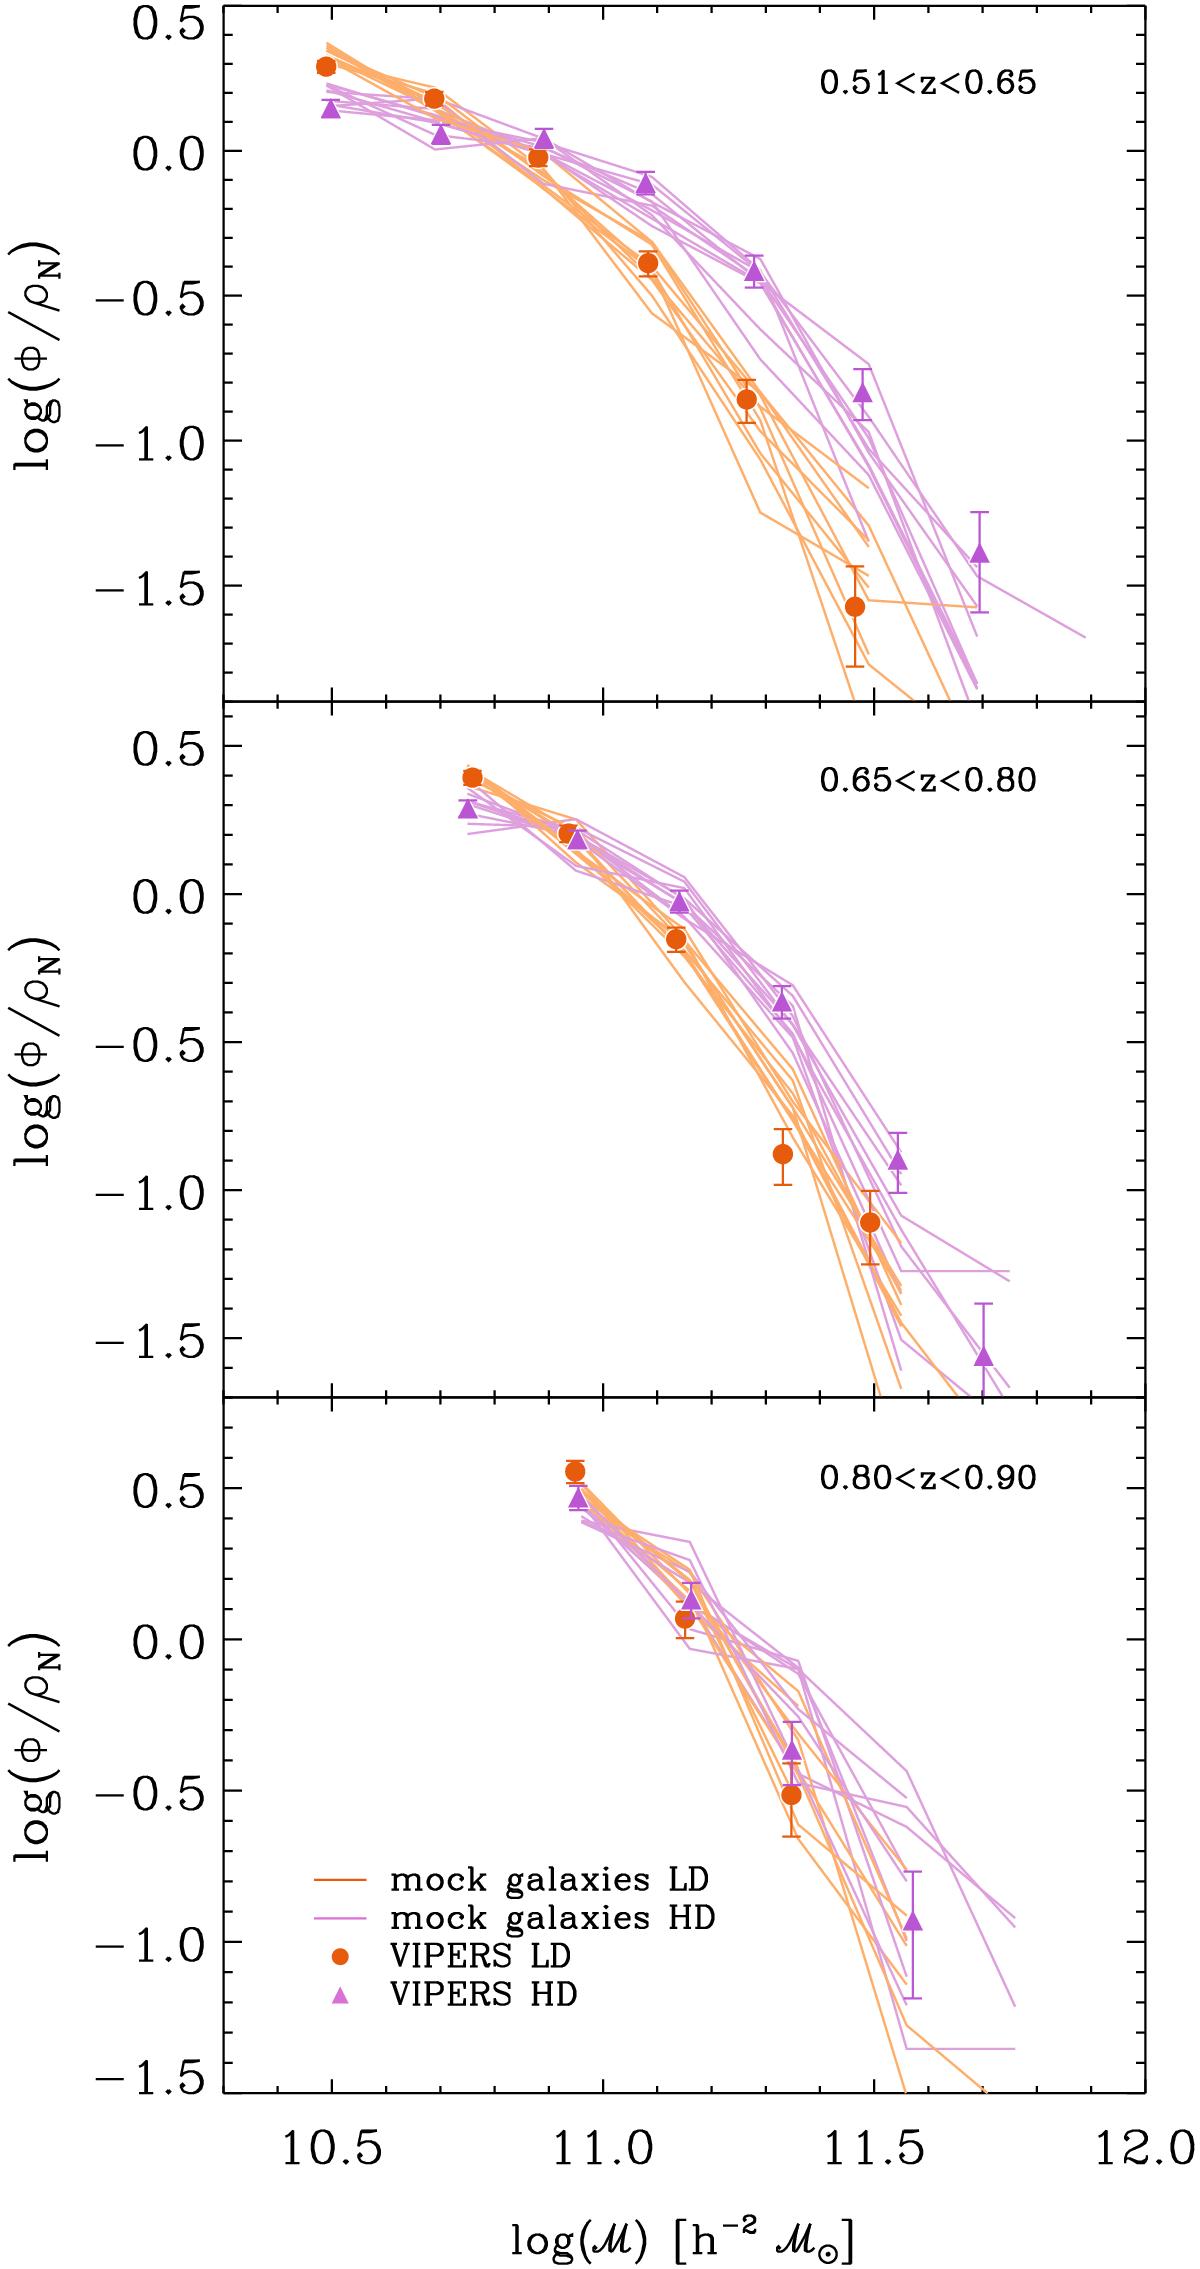
Stellar mass functions of mock galaxies built from the Millennium simulation through the semi-analytical model of De Lucia & Blaizot (2007). The 10 mock realisations correspond to the solid lines (orange and violet for LD and HD regions, respectively), while symbols with error bars show the GSMF of VIPERS in the two environments (the same as Fig. 4). All the mass functions are plotted starting from the completeness limit (ℳlim) at that redshift. They are obtained by means of the 1 /Vmax method, rescaled to have the same number density ρN when integrating Φ (ℳ at ℳ > ℳlim.
Current usage metrics show cumulative count of Article Views (full-text article views including HTML views, PDF and ePub downloads, according to the available data) and Abstracts Views on Vision4Press platform.
Data correspond to usage on the plateform after 2015. The current usage metrics is available 48-96 hours after online publication and is updated daily on week days.
Initial download of the metrics may take a while.