Fig. 7
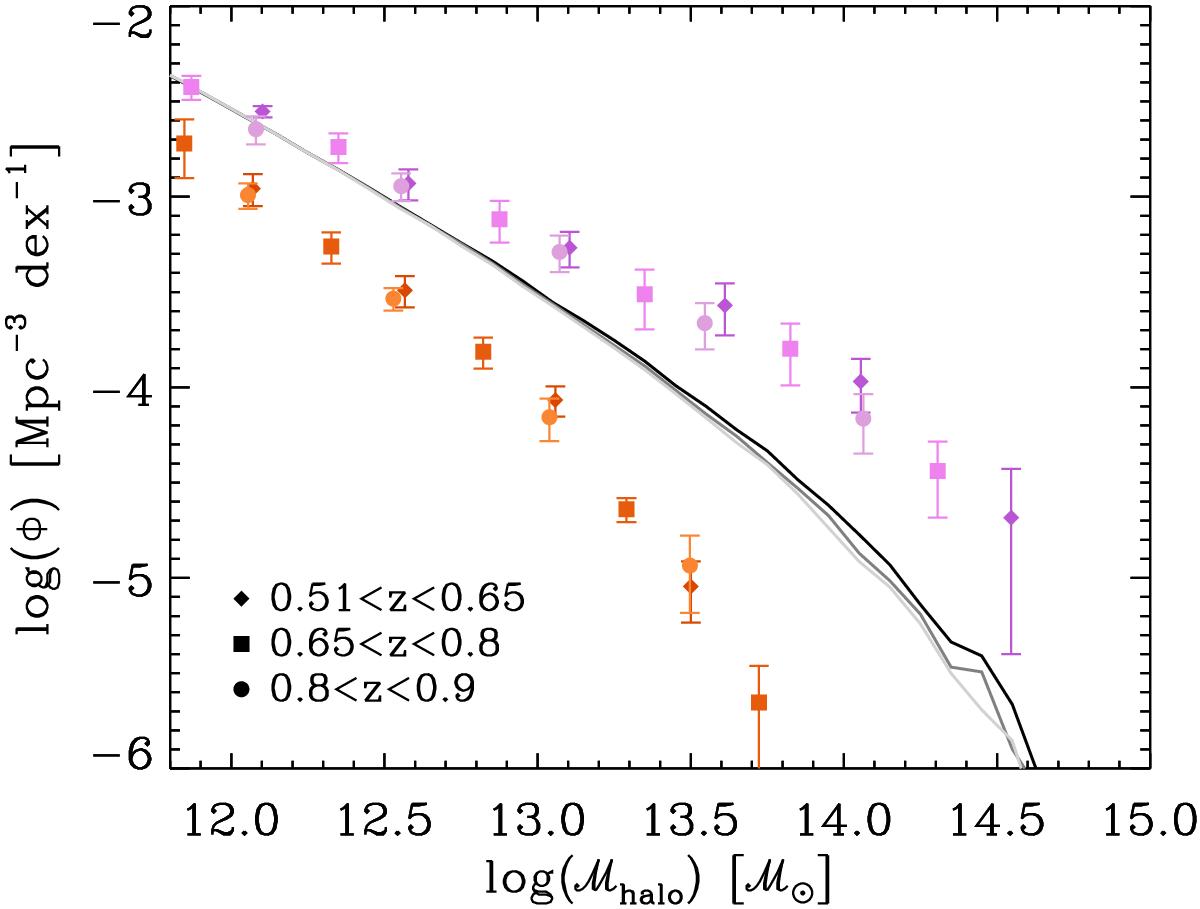
Halo mass function derived from the simulation described in Sect. 5.1, restricted to galaxies in the HD and LD environment (violet and orange symbols, respectively). Different symbols are estimated in the three redshift bins quoted in the bottom-left corner of the plot, with error bars obtained from the variance among the 10 mock catalogues. The mass function of haloes in the entire box (![]() side), at snapshots consistent with our redshift bins, is shown as reference with solid lines (darker colour at lower z).
side), at snapshots consistent with our redshift bins, is shown as reference with solid lines (darker colour at lower z).
Current usage metrics show cumulative count of Article Views (full-text article views including HTML views, PDF and ePub downloads, according to the available data) and Abstracts Views on Vision4Press platform.
Data correspond to usage on the plateform after 2015. The current usage metrics is available 48-96 hours after online publication and is updated daily on week days.
Initial download of the metrics may take a while.