Fig. 5
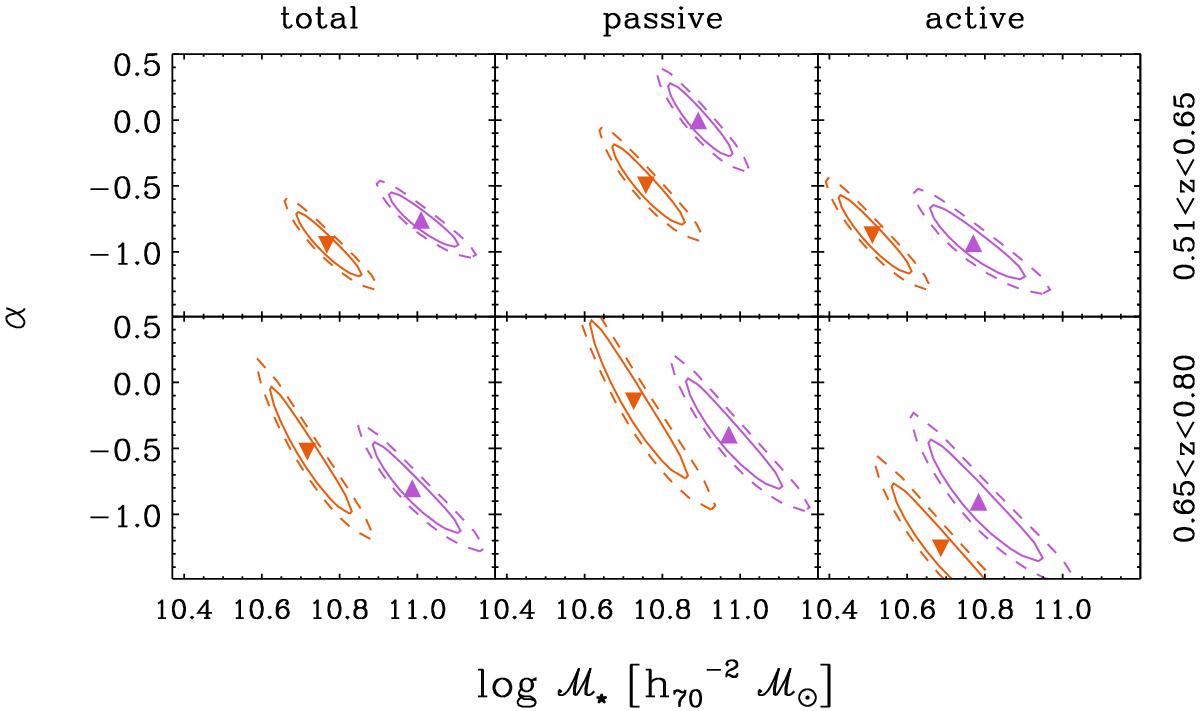
Schechter (1976) parameters (filled symbols) of the GSMFs at redshift 0.51 < z < 0.65 and 0.65 < z < 0.8, where α was left free during the STY fitting (cf. Fig. 4). The solid- and dashed-line contours represent the 68.3 and 90% CL, respectively. Orange lines and downward triangles are the estimates for galaxies in the LD regions, violet lines, and upward triangles are used for the HD ones. Each panel deals with a different sample (total, passive, and active galaxies from left to right). All the values were obtained by using the algorithms contained in the ALF suite (Ilbert et al. 2005).
Current usage metrics show cumulative count of Article Views (full-text article views including HTML views, PDF and ePub downloads, according to the available data) and Abstracts Views on Vision4Press platform.
Data correspond to usage on the plateform after 2015. The current usage metrics is available 48-96 hours after online publication and is updated daily on week days.
Initial download of the metrics may take a while.