Fig. 4
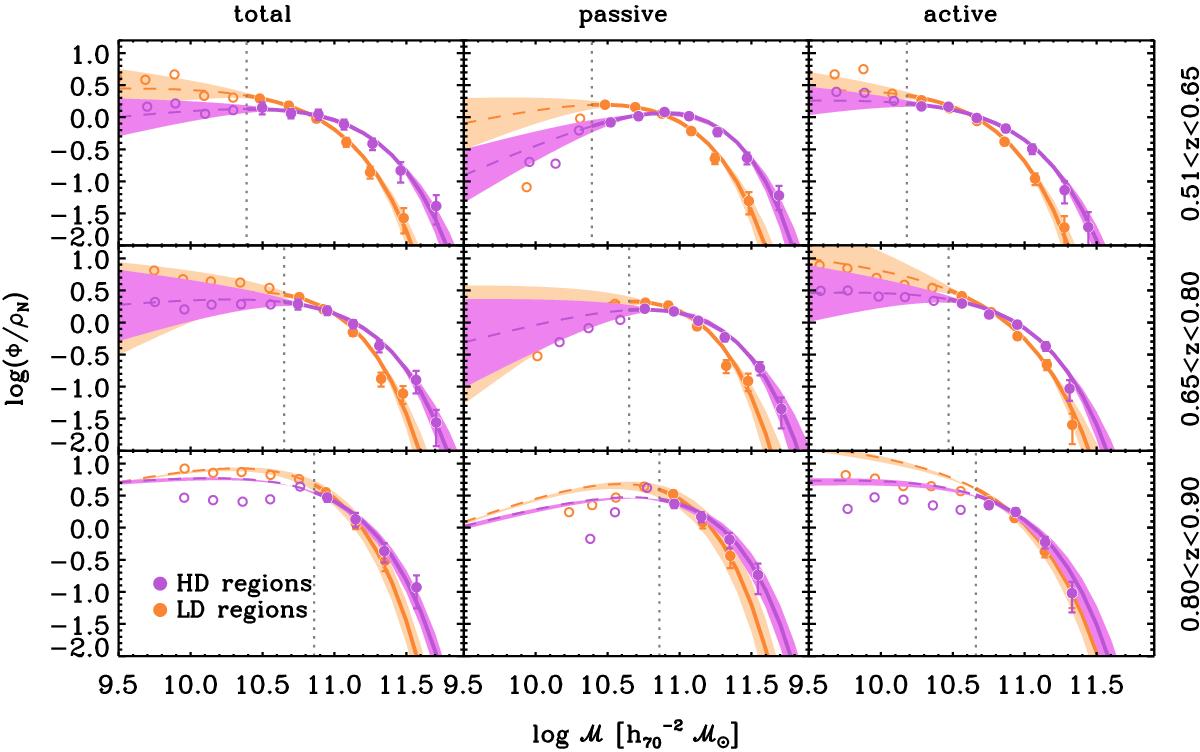
Stellar mass functions of galaxies at low density (orange symbols) and high density (violet symbols) in three different redshift bins, namely ![]() ,
, ![]() , and
, and ![]() . Right panels show the GSMFs of active galaxies, while central panels refer to passive ones. The GSMFs of the whole sample in the same z-bins are shown on the left. In each plot, filled (open) circles represent the 1 /Vmax points above (below) the completeness mass ℳlim (vertical dot line), with error bars (shown only above ℳlim) that account for Poisson uncertainty. In the total GSMFs, the uncertainty due to cosmic variance is also added in the error bars. (In some cases, the error bar is smaller than the size of the points.) Solid lines represent the Schechter functions estimated through the STY method, with the 1σ uncertainty highlighted by a shaded area. With this estimator, all the Schechter parameters are free, except at
. Right panels show the GSMFs of active galaxies, while central panels refer to passive ones. The GSMFs of the whole sample in the same z-bins are shown on the left. In each plot, filled (open) circles represent the 1 /Vmax points above (below) the completeness mass ℳlim (vertical dot line), with error bars (shown only above ℳlim) that account for Poisson uncertainty. In the total GSMFs, the uncertainty due to cosmic variance is also added in the error bars. (In some cases, the error bar is smaller than the size of the points.) Solid lines represent the Schechter functions estimated through the STY method, with the 1σ uncertainty highlighted by a shaded area. With this estimator, all the Schechter parameters are free, except at ![]() , where α is fixed to the value found in the previous z-bin (see Table 2). To compare the shape of mass functions in LD and HD, we renormalise them in such a way that their number density (ρN) is equal to unity when we integrate the GSMF at ℳ > ℳlim.
, where α is fixed to the value found in the previous z-bin (see Table 2). To compare the shape of mass functions in LD and HD, we renormalise them in such a way that their number density (ρN) is equal to unity when we integrate the GSMF at ℳ > ℳlim.
Current usage metrics show cumulative count of Article Views (full-text article views including HTML views, PDF and ePub downloads, according to the available data) and Abstracts Views on Vision4Press platform.
Data correspond to usage on the plateform after 2015. The current usage metrics is available 48-96 hours after online publication and is updated daily on week days.
Initial download of the metrics may take a while.