Fig. 2
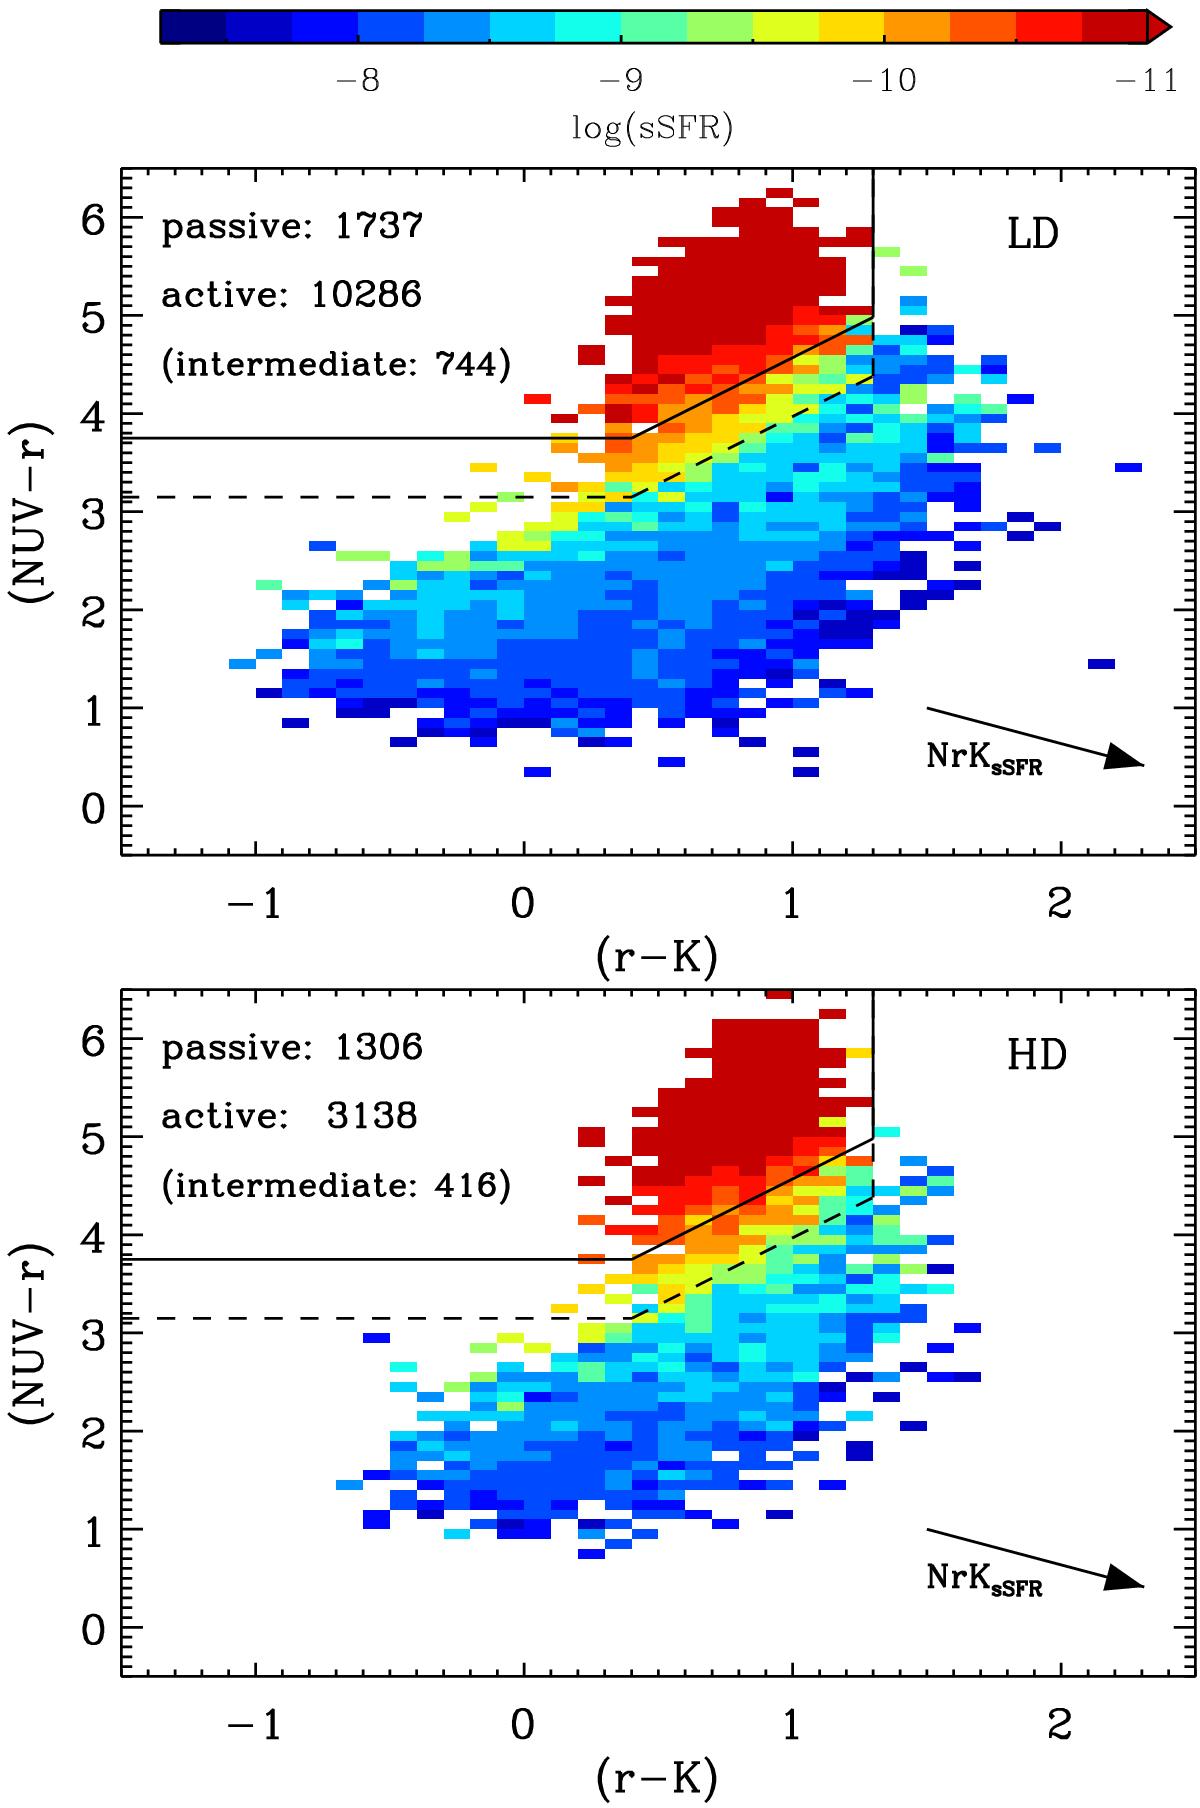
NUVrK diagram of the VIPERS galaxies between z = 0.51 and 0.9, in the LD environment (top panel) and in HD (bottom panel). According to our classification, passive galaxies lie above the solid line (defined in Eq. (2)), while the dashed line (Eq. (3)) divides galaxies with intense star formation (bottom part of the diagram) from those having low sSFR (see text). In the rest of the paper, the two classes are treated as a whole sample of active objects. Their number (and the number of passive galaxies) in each environment is shown in the top-left corner of the plots. Each colour-coded pixel represents the median sSFR of the galaxies inside it, estimated by means of SED fitting. Arnouts et al. (2013) find that in this diagram the sSFR increases because moving along the direction [(r−K),(NUV−r)] = [(r−K)0 + sin(54°),(NUV−r)0−cos(54°)], identified by the bottom-right vector NrKsSFR (note that the different scale in x- and y-axis warps the angles).
Current usage metrics show cumulative count of Article Views (full-text article views including HTML views, PDF and ePub downloads, according to the available data) and Abstracts Views on Vision4Press platform.
Data correspond to usage on the plateform after 2015. The current usage metrics is available 48-96 hours after online publication and is updated daily on week days.
Initial download of the metrics may take a while.