Fig. B.1
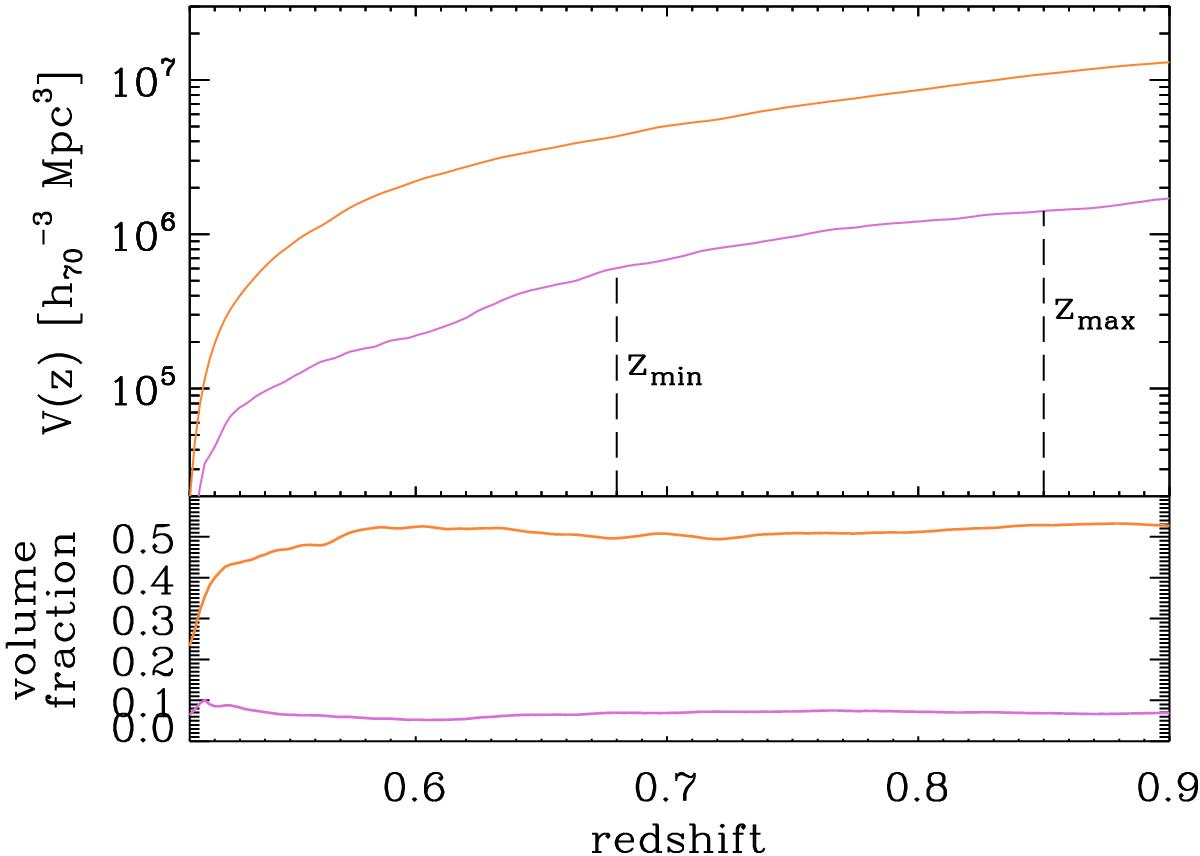
Upper panel: function of the comoving volume between redshift 0.51 and z, filled by either HD and LD regions (violet and orange lines). The function is evaluated by means of a Monte Carlo integration as described in the text. To find the Vmax of a galaxy, one has to consider the volume between its minimum and maximum allowed redshift (zmin and zmin, see the vertical dashed lines as an example). Lower panel: the fraction of the total volume (between z = 0.5 and the given redshift) occupied by HD and LD regions (violet and orange lines).
Current usage metrics show cumulative count of Article Views (full-text article views including HTML views, PDF and ePub downloads, according to the available data) and Abstracts Views on Vision4Press platform.
Data correspond to usage on the plateform after 2015. The current usage metrics is available 48-96 hours after online publication and is updated daily on week days.
Initial download of the metrics may take a while.