Fig. 10
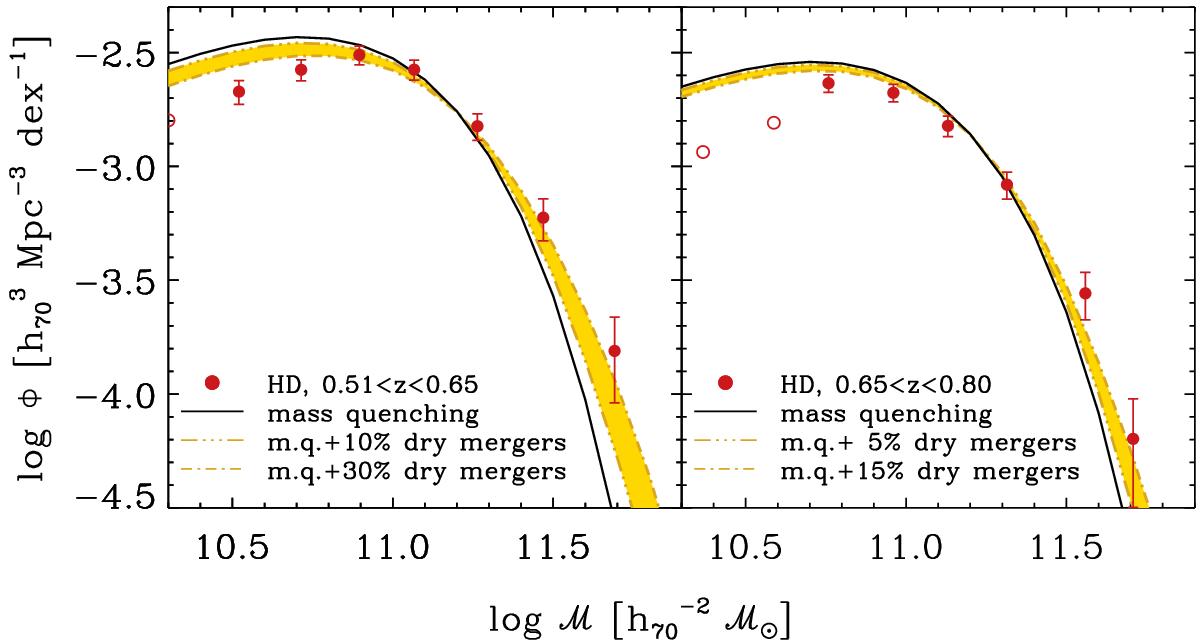
Evolution of the passive mass function in the HD environment, including dry mergers. The solid line in each panel is the predicted GSMF in the HD environment, as in Fig. 9, assuming only mass quenching and the sSFR parametrisation of P10; yellow shaded area is the GSMF modified by dry mergers, whose percentage ranges from 5–10% (triple-dot-dashed line) to 15–30% (dot-dashed line) depending on the redshift bin. In each z-bin, red circles are the 1 /Vmax estimates (with Poissonian errors) of the stellar mass function of the VIPERS passive galaxies (symbols are filled above the completeness limit ![]() ).
).
Current usage metrics show cumulative count of Article Views (full-text article views including HTML views, PDF and ePub downloads, according to the available data) and Abstracts Views on Vision4Press platform.
Data correspond to usage on the plateform after 2015. The current usage metrics is available 48-96 hours after online publication and is updated daily on week days.
Initial download of the metrics may take a while.