Fig. 1
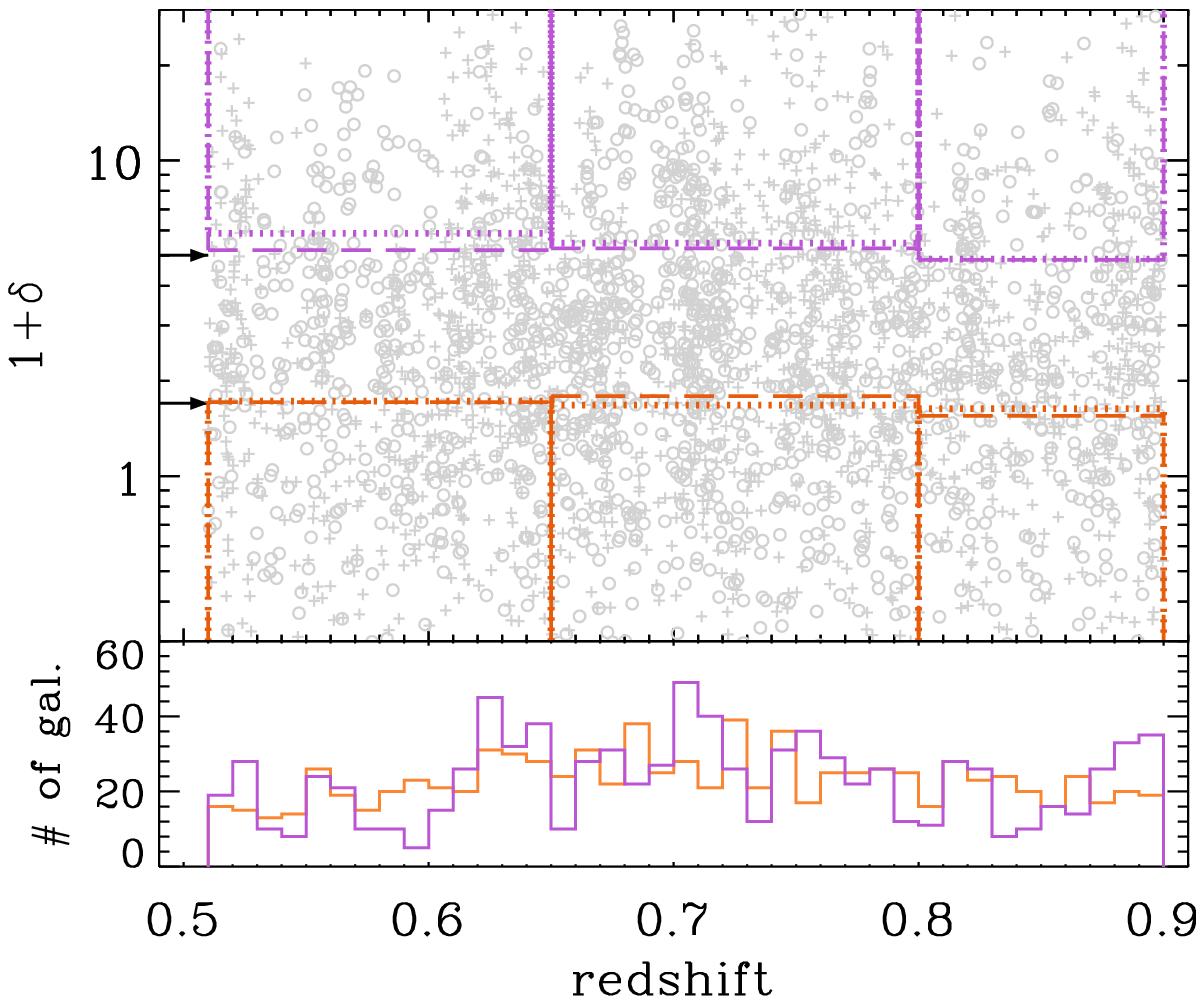
Upper panel: galaxy density contrast of a mass-limited sample having log (ℳ/ℳ⊙) >10.86. Galaxies from the W1 field are marked with plus signs, from W4 with open circles. For each redshift bin, galaxies below the 25th (above the 75th) percentile of the 1 + δ distribution are enclosed by orange (violet) rectangles (dotted lines for W1, dashed lines for W4). The two thresholds that define LD and HD, as discussed in Sect. 3.1, are indicated by an arrow on the left side of the plot. Lower panel: combining the two fields together, histograms represent the redshift distribution of the LD and HD sub-sample in orange and violet ,respectively.
Current usage metrics show cumulative count of Article Views (full-text article views including HTML views, PDF and ePub downloads, according to the available data) and Abstracts Views on Vision4Press platform.
Data correspond to usage on the plateform after 2015. The current usage metrics is available 48-96 hours after online publication and is updated daily on week days.
Initial download of the metrics may take a while.