Fig. 7
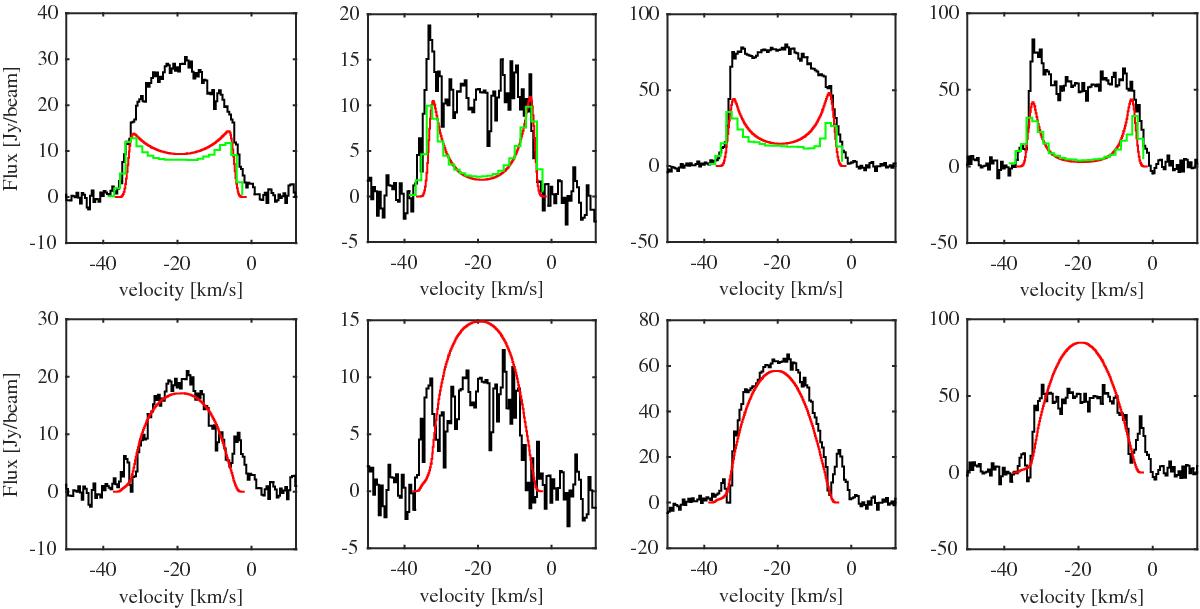
Top: SD spectra (black, from left to right: SEST 12CO(1−0), IRAM 12CO(1−0), APEX 12CO(2−1), and APEX 12CO(3−2)) with the best-fit shell model convolved with the respective beams (red). The green spectra show the shell emission extracted from the ALMA data and convolved with the respective SD beams. Bottom: SD spectra after subtracting the best-fit shell models. The red lines show the best-fit model fit to the shell-subtracted SD observations to constrain the average mass-loss rate since creation of the shell.
Current usage metrics show cumulative count of Article Views (full-text article views including HTML views, PDF and ePub downloads, according to the available data) and Abstracts Views on Vision4Press platform.
Data correspond to usage on the plateform after 2015. The current usage metrics is available 48-96 hours after online publication and is updated daily on week days.
Initial download of the metrics may take a while.