Fig. 9
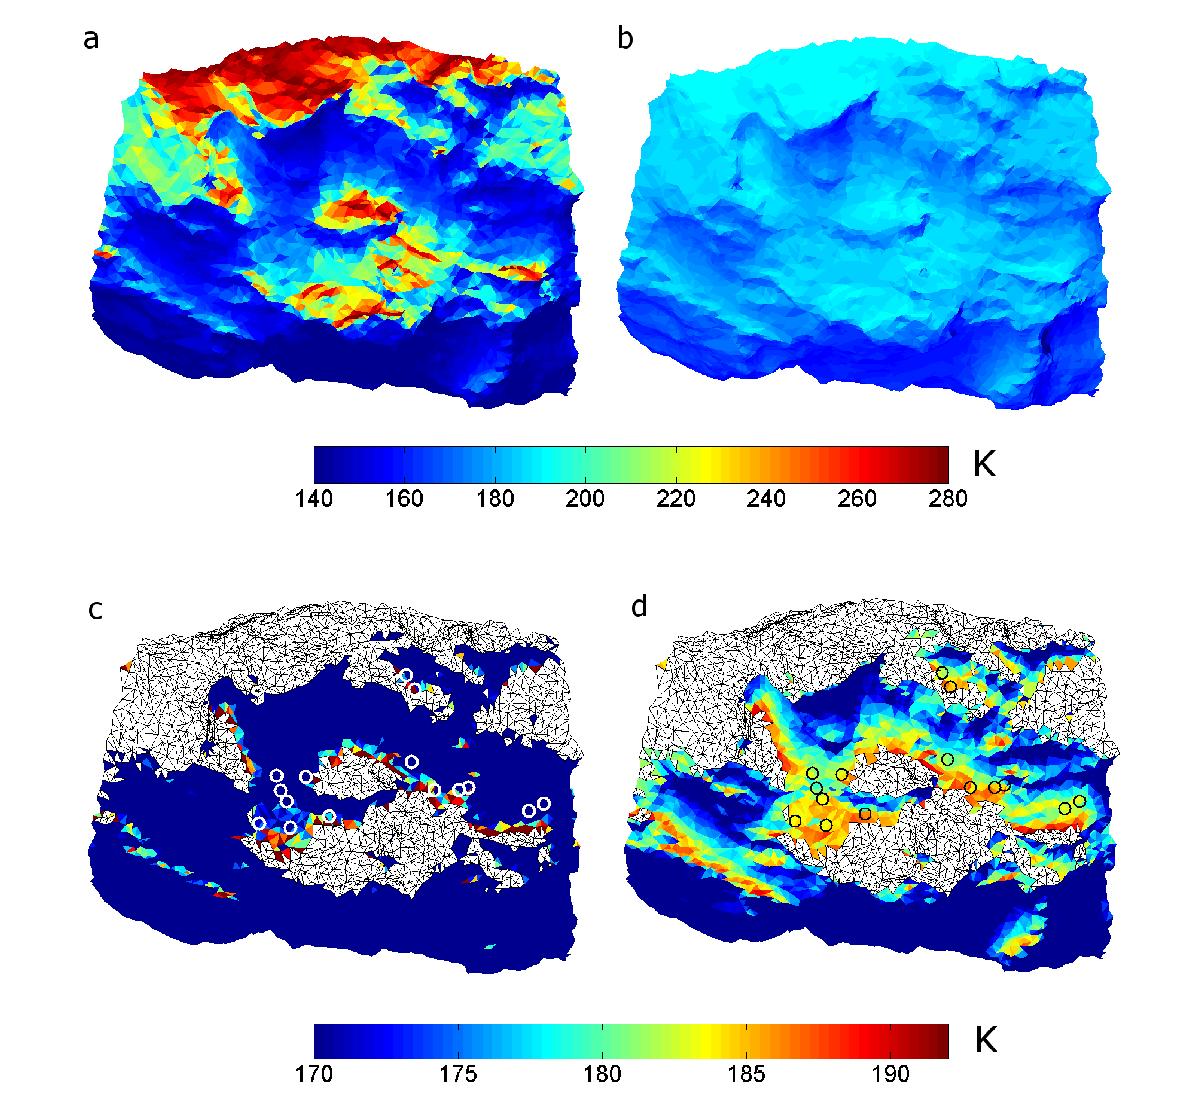
Modeled temperatures in the source area at the time of observation of Fig. 2h based on a local shape model. a) Surface temperature. b) Sublimation temperature. c) and d) same results as in a) and b), respectively, for the unilluminated areas. A refined colormap is used to show the variation in sublimation temperature. Facets corresponding to the illuminated areas are masked in white.
Current usage metrics show cumulative count of Article Views (full-text article views including HTML views, PDF and ePub downloads, according to the available data) and Abstracts Views on Vision4Press platform.
Data correspond to usage on the plateform after 2015. The current usage metrics is available 48-96 hours after online publication and is updated daily on week days.
Initial download of the metrics may take a while.