Fig. 8
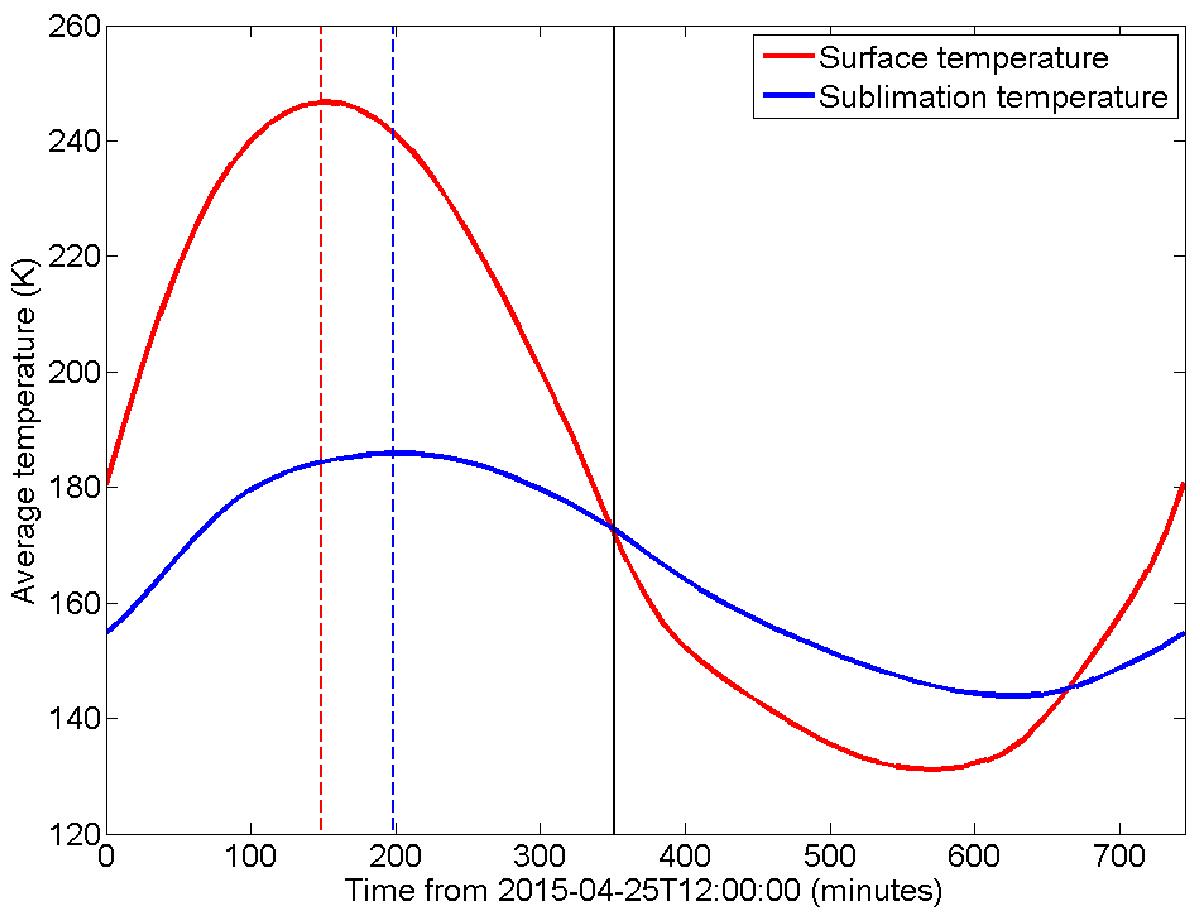
Diurnal variation of the surface and sublimation temperatures averaged over the entire source area during one rotational period on April 25, 2015. The solid black line indicates the time of observation for Fig. 2b. The dotted red and blue lines indicate the location of maximum values in average surface and sublimation temperature, respectively; the offset is a measure of thermal lag in the subsurface layer.
Current usage metrics show cumulative count of Article Views (full-text article views including HTML views, PDF and ePub downloads, according to the available data) and Abstracts Views on Vision4Press platform.
Data correspond to usage on the plateform after 2015. The current usage metrics is available 48-96 hours after online publication and is updated daily on week days.
Initial download of the metrics may take a while.