Fig. 5
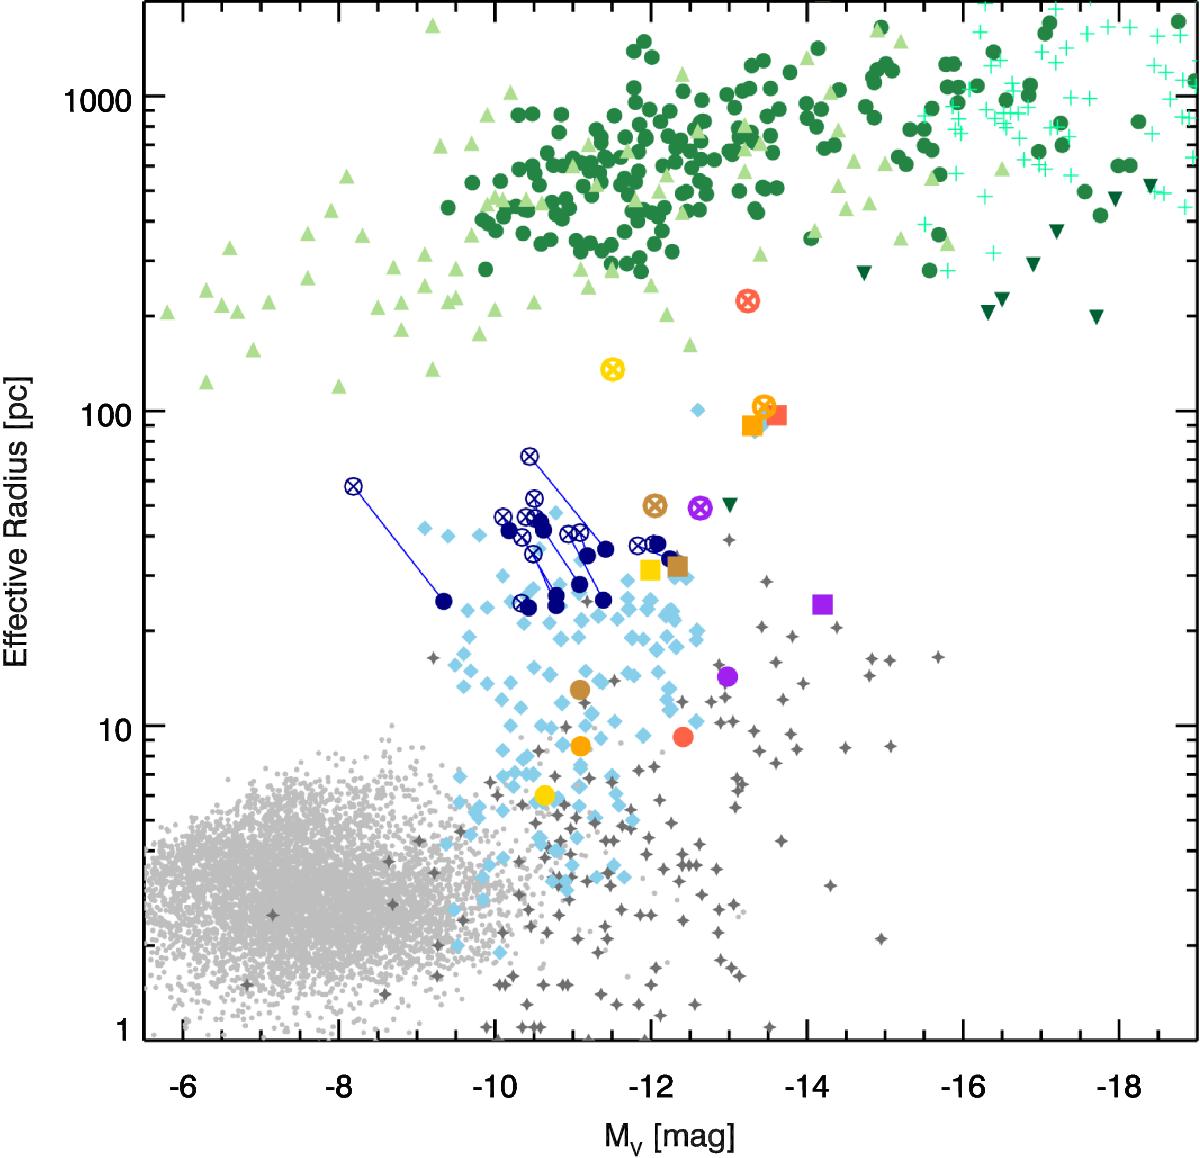
Relation between the effective radius and the absolute visual magnitude of several types of early-type systems are shown. We show in green dots dEs in the Hydra and Centaurus clusters taken from Misgeld et al. (2008, 2009). The light green triangles are dSphs in the Local Group from McConnachie (2012). The inverted green triangles are compact ellipticals from Price et al. (2009). Light green plus signs represent early-type galaxies from Ferrarese et al. (2006). Light gray dots are the Fornax Cluster GCs from the ACVCS survey (Jordán et al. 2007). The dark gray star symbols are the nuclear star clusters from Georgiev & Böker (2014). In light blue, we show an assembly of UCDs with measured sizes taken from (Mieske et al. 2008; Brodie et al. 2011; Forbes et al. 2013; Evstigneeva et al. 2008; Haşegan et al. 2005). We plot in navy blue dots the effective radii from the Sérsic profile fit. The connected navy circles with a cross shows which sizes we derived for the envelopes of a two-component King+Sérsic model to each of our UCDs when we assume a 11.6 pc King component in their centers. The yellow, orange, red, and brown symbols show the five known decomposed UCDs with clear double profiles in the literature. Squares are the single component fits, dots the core component, and circles with crosses the envelope component. The red points denote (VUCD7), orange (UCD3) and yellow (UCD5), all taken from Evstigneeva et al. (2007). Purple symbols show M60-UCD1 taken from Strader et al. (2013) and the brown symbols are M59cO taken from Chilingarian et al. (2008).
Current usage metrics show cumulative count of Article Views (full-text article views including HTML views, PDF and ePub downloads, according to the available data) and Abstracts Views on Vision4Press platform.
Data correspond to usage on the plateform after 2015. The current usage metrics is available 48-96 hours after online publication and is updated daily on week days.
Initial download of the metrics may take a while.